Most conversations about America's affordable-housing crunch reach for the same handful of states: California, New York, Florida. But when you look at how long families actually wait for a Section 8 Housing Choice Voucher and, crucially, how that wait has changed over the last few years - a very different map emerges.
We analysed the US Department of Housing and Urban Development's (HUD) own state-level records for the Housing Choice Voucher program from 2022 to 2025. We found that the average wait now exceeds five years in Maryland, tops four years in New Hampshire, and the longest waits in the country are increasingly clustered in the Northeast - not the usual large-metro hotspots.
Across the 50 jurisdictions we could measure, the average wait rose by 15.6% in just three years.
Here's what the data shows, why it's happening, and what it means for the tenants waiting and the landlords who house them.
Explore the section 8 wait times data
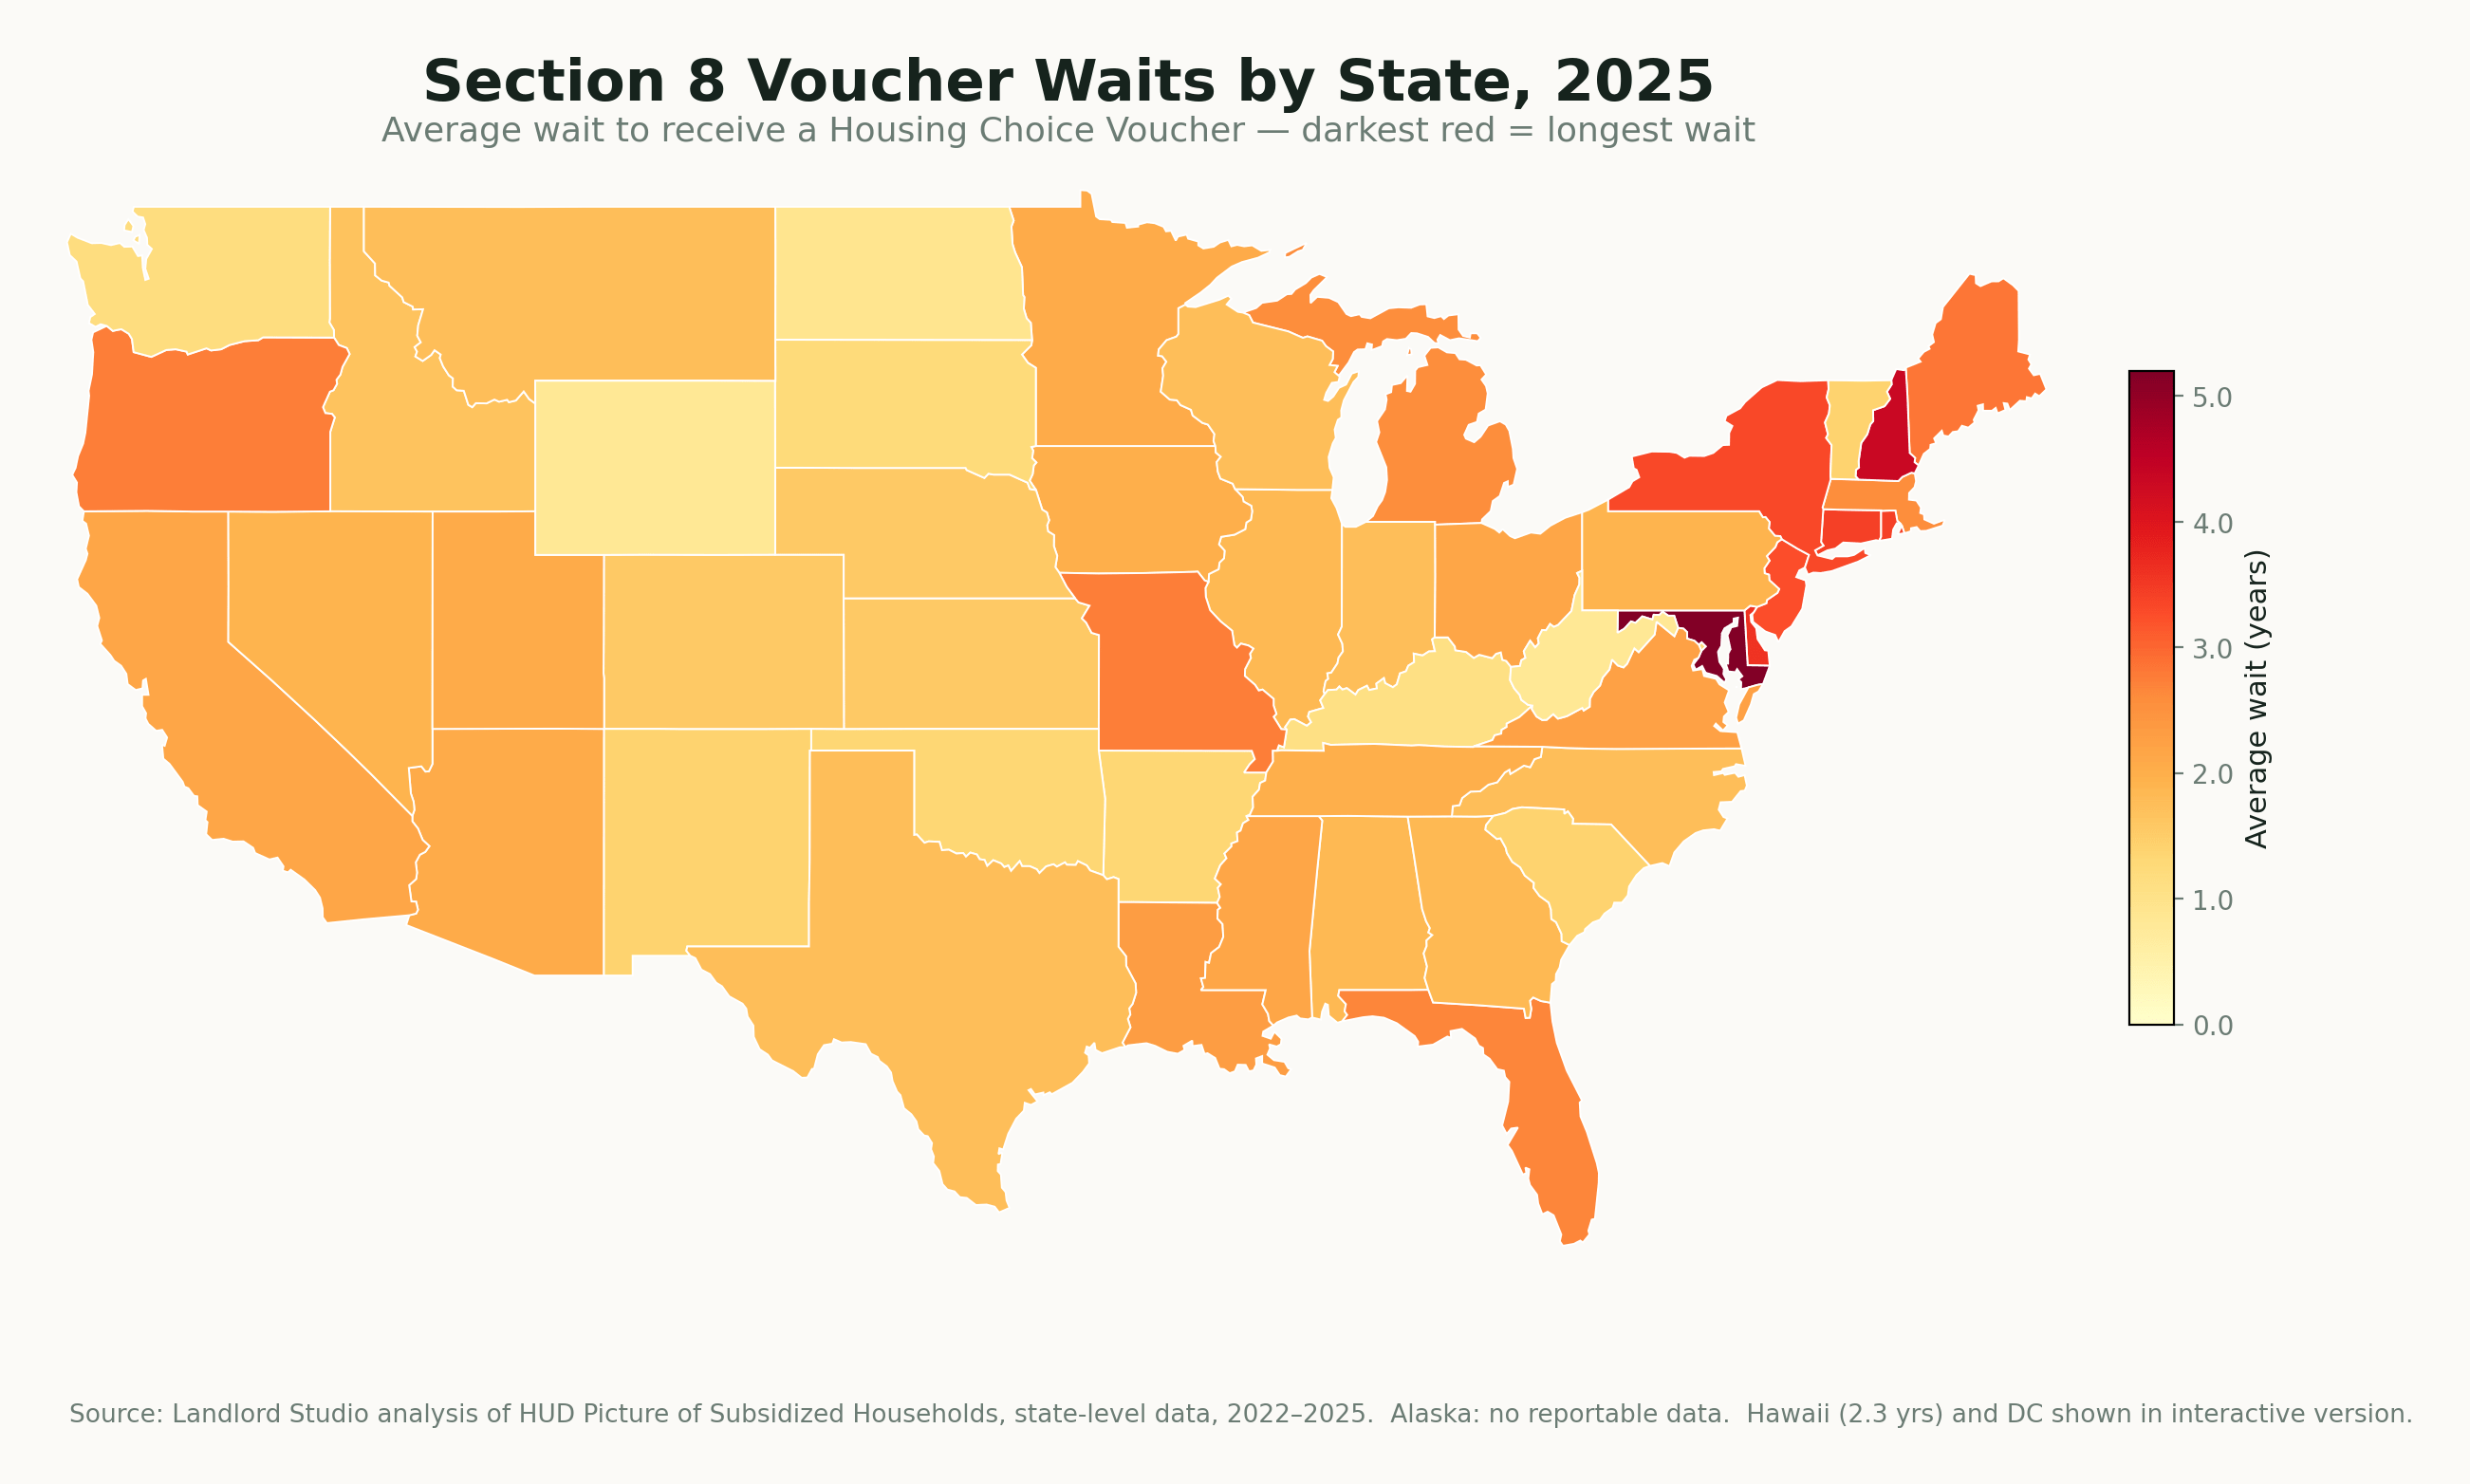
Section 8 voucher waits by state, 2022–2025
Average wait between joining a Housing Choice Voucher waitlist and being admitted to the program. Source: HUD Picture of Subsidized Households. Search, sort and filter all 50 jurisdictions below.
State
2022
2025
Change
% change
Voucher households
No states match your search.
Waits shown in years (HUD reports whole months; one decimal is a fraction of a year, not months). Percentage changes are calculated from the underlying month values. Alaska is omitted (no reportable data).
Breakdown of Section 8 findings
1) Maryland has the longest section 8 wait in the country
Maryland now has the longest average Section 8 wait of any state: 5.2 years in 2025, up from 2.8 years in 2022. That's an increase of about two and a half years - the largest absolute jump anywhere in the country and it pushes Maryland past every other state, including the ones that usually dominate the affordability conversation.
To put that in human terms: a family that joined a Maryland voucher waitlist when this measurement period began would, on average, still be waiting today. And because this figure reflects the historical wait of households who were actually admitted, it's a floor, not a ceiling — applicants joining a closed or backlogged list today may face longer still.
2) The Northeast is the new epicenter
Maryland isn't alone. Sorting the data by 2025 wait time reveals a striking regional pattern: seven jurisdictions now average more than three years, and they form a tight Northeast cluster.
Maryland - 5.2 years
New Hampshire - 4.3 years
Delaware - 3.6 years
Connecticut - 3.4 years
Rhode Island - 3.4 years
New York - 3.3 years
New Jersey - 3.3 years
New York deserves a special mention - not for the length of its wait, but for its sheer scale. With roughly 294,000 voucher households, it runs by far the largest program among the long-wait states, making it the single biggest concentration of multi-year-waiting voucher households in the country.
3) The steepest increases are in unexpected places
If Maryland is the worst in absolute terms, the fastest growth is happening in states that rarely make housing headlines:
Nevada - the average wait more than doubled, from roughly 0.9 to 1.9 years (+109%)
Maryland: +88%
Delaware: +72%
Hawaii: +69%
Rhode Island: +58%
Meanwhile, two of the states everyone expects to top these lists went the other way: California's average wait actually fell (−13%) over the period, and Florida's was broadly flat (+10%). The crisis, in other words, is spreading to places that aren't braced for it.
4) Several states recorded large declines
It would be easy and misleading to frame this as "waits are getting worse everywhere." They aren't. Several states recorded large declines:
Alabama - from 4.1 to 1.8 years (−55%)
New Jersey - from 5.6 to 3.3 years (−42%)
Massachusetts - from 3.8 to 2.6 years (−33%)
These are real improvements, and they matter. They show that wait times aren't fixed by geography or destiny — they move, sometimes sharply, with funding, administration, and local market conditions. That makes the states heading the wrong way all the more worth watching.
Why this is happening
The Housing Choice Voucher program was designed as a flexible, market-based alternative to public housing. Much of it depends on private landlords being willing to accept a voucher and house a tenant. When that willingness drops or when funding fails to keep pace with rents and demand, the bottleneck doesn't show up as a headline. It shows up as a waitlist that stops moving.
That's what makes the wait-time metric so revealing. A five-year average wait, or a major-metro waitlist that's been closed for years, is a sign that the program has stopped functioning as a flexible voucher and started functioning as a lottery - one with very long odds and a very long line.
The timing matters, too. HUD is currently weighing a proposed rule that would let local housing agencies impose work requirements and time limits on Section 8 assistance; the public comment period closed on 1 May 2026.
Layering time limits onto a system where the average wait already exceeds five years in the hardest-hit states raises hard questions about how the two are meant to coexist.
What this means for landlords
For the independent landlords who actually house voucher families, long and unpredictable waits are part of a broader friction: closed lists, slow placements, inspection and payment delays, and uncertainty about the program's future direction.
Each of those nudges some landlords toward opting out of the program altogether - which, in turn, lengthens the wait for everyone still in the queue. It's a feedback loop, and the wait-time data is one of the clearest windows into it.
Understanding where the program is straining (and where it's improving) helps landlords, tenants, and policymakers have a more honest conversation about what's actually broken and what's working.
Do landlords have to accept Section 8 vouchers?
It depends on location. Section 8 is a voluntary program for landlords under federal law - there is no nationwide requirement to accept vouchers. However, a growing number of states, counties and cities have passed "source of income" laws that make it illegal to refuse a tenant simply because they would pay with a Housing Choice Voucher. In those jurisdictions, a landlord generally cannot turn an applicant away for using a voucher, though they can still apply their normal screening criteria. Because these laws vary widely, landlords should check the rules in their specific state and city.
Why are so many Section 8 waiting lists closed?
Demand for vouchers far exceeds the funding available, so local housing authorities often close their waiting lists rather than keep adding applicants to a queue that already stretches for years. When a list is closed, no new applications are accepted until the authority reopens it — which may be months or years away, and is sometimes done by lottery. Long waits and closed lists are two sides of the same problem: a program where the number of people who qualify greatly outnumbers the vouchers that can be funded.
Does Section 8 benefit landlords or tenants?
It's designed to work for both, though each side weighs different trade-offs. For tenants, the benefit is clear: affordable, stable housing, with rent kept to a manageable share of income. For landlords, a voucher offers a reliable, government-backed portion of the rent paid on time each month, plus access to a steady pool of tenants - but in exchange for inspections, paperwork, rent caps, and sometimes payment delays.
In practice, the balance shifts with the market. When rents are rising fast, some landlords find they can earn more outside the program and opt out, which lengthens waits for tenants. When the market softens, voucher tenants become more attractive for their stability. So rather than one side "winning," Section 8 is a trade-off that holds together only when it works for landlords and tenants at the same time - and long waitlists are a sign that balance has slipped.
Data methodology
This analysis draws on HUD's Picture of Subsidized Households dataset (state-level files, 2022–2025). Our central metric is HUD's average wait time for the Housing Choice Voucher program—the months from joining a waiting list to admission—which we report in years for readability.
We used HUD's combined voucher figure (tenant-based and project-based), since HUD only began publishing a separate breakdown at state level in 2025. States were included where HUD reported valid figures in both 2022 and 2025: 50 of 51 jurisdictions qualified (50 states plus DC), with only Alaska excluded for lacking a reportable figure.
Unlike earlier point-in-time analyses (such as the Center on Budget and Policy Priorities'), we focus on the change between 2022 and 2025 - which states' waits are rising and falling fastest.
Data source: HUD Picture of Subsidized Households, 2022–2025, available at huduser.gov. Analysis by Landlord Studio.
About Landlord Studio
Landlord Studio is an easy to use property management and accounting software designed for landlords.
Find and screen tenants, collect rent online, track income and expenses, run reports, and more - all for free.
Get weekly tips, tax updates, and landlord strategies straight to your inbox.
Thanks for subscribing. Check your inbox, your first update is on the way.
Oops! Something went wrong while submitting the form.
Webinar: Inherited Tenants: Due Diligence for Buyers
A due diligence playbook for investors buying tenant-occupied rentals - uncover the hidden risks, plug the profit leaks, and build the systems that turn an inherited tenancy into a value increase.
Details:
Free
Hosted by:
Matt Hardy
Jennifer Ruelens
When:
August 26, 2026
10:00am PT / 1:00pm ET
Duration:
45 mins
Format:
Live Webinar
Guest:
Jennifer Ruelens, Property Manager, Investor & Founder with 20+ Years Experience in Real Estate
Co-host Matt Hardy, Head of Marketing at Landlord Studio


.jpg)
.jpg)


