




Read summarized version with:

ChatGPT

Gemini

Claude

Grok

Add as preferred on Google
Recorded vacancy between tenancies has risen in Landlord Studio's US rental data.
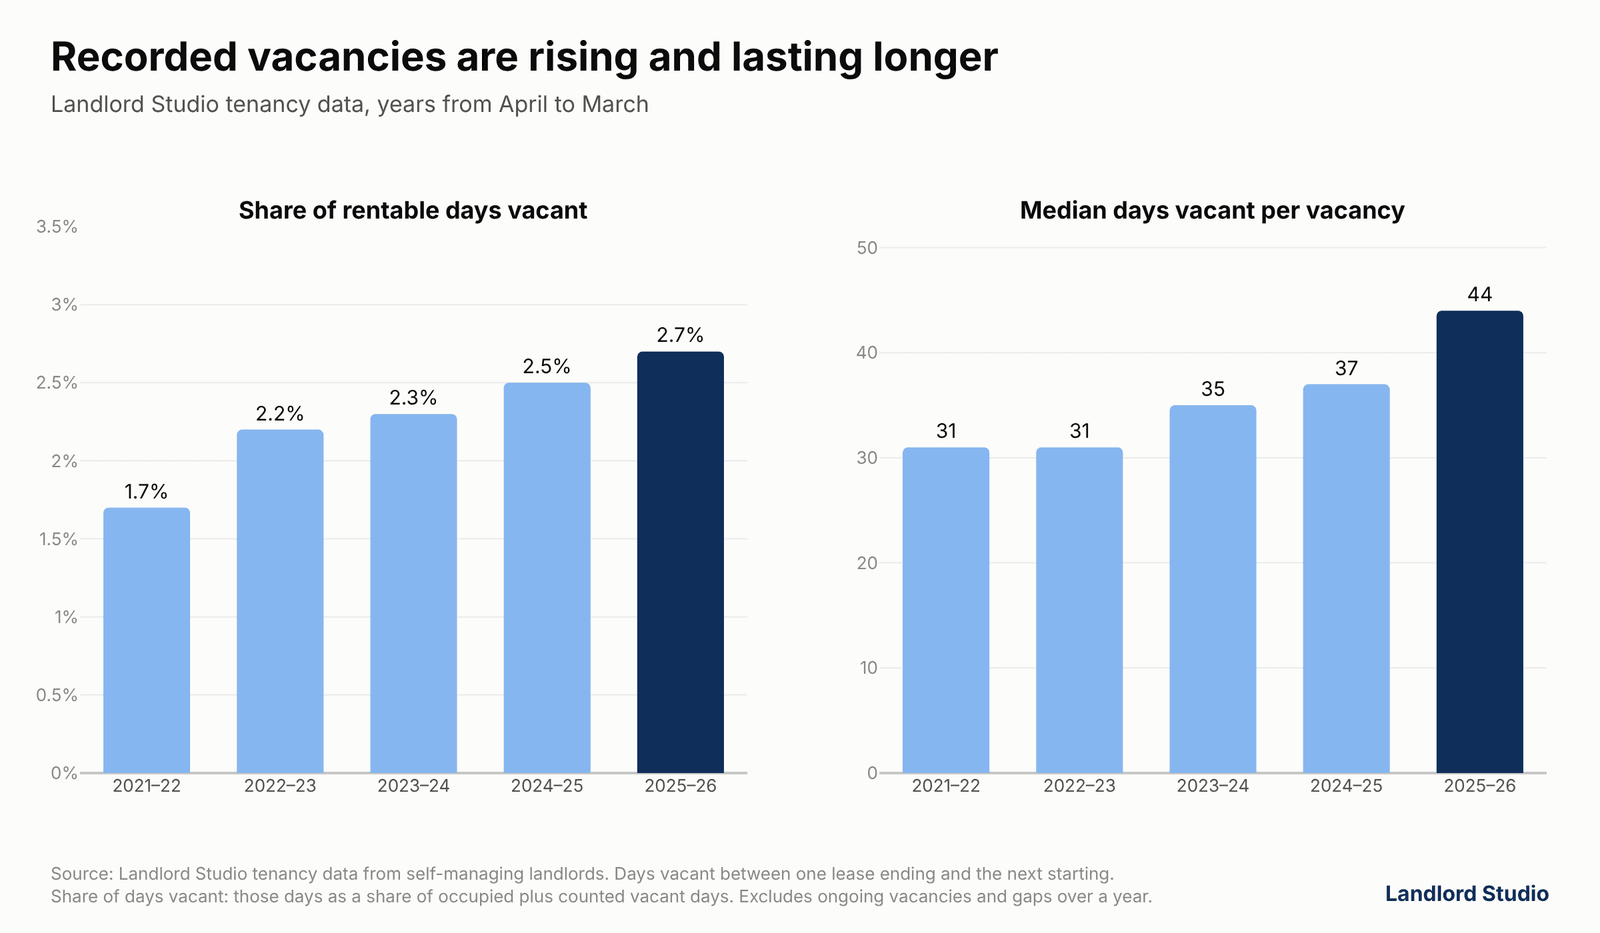
We analyzed five years of tenancy records on more than 60,000 US rental homes. Landlords lost 2.7% of their rentable days to vacancy in the year to March 2026, up from 1.7% in 2021–22.
When a tenant moves out, the typical home now stays vacant for 44 days before the next lease starts, against 31 days four years earlier. The Census Bureau's rental vacancy rate has risen too, reaching 7.1% in 2025.
Our figures measure recorded gaps between tenancies, excluding ongoing vacancies and gaps longer than a year. They are not directly comparable with the Census rental vacancy rate.
Key findings
- Landlords lost 2.7% of rentable days to vacancy in 2025–26, up from 1.7% in 2021–22.
- The typical vacancy now runs 44 days from move-out to the next lease, up from 31 days. Only 37% are filled within 30 days, down from 48%.
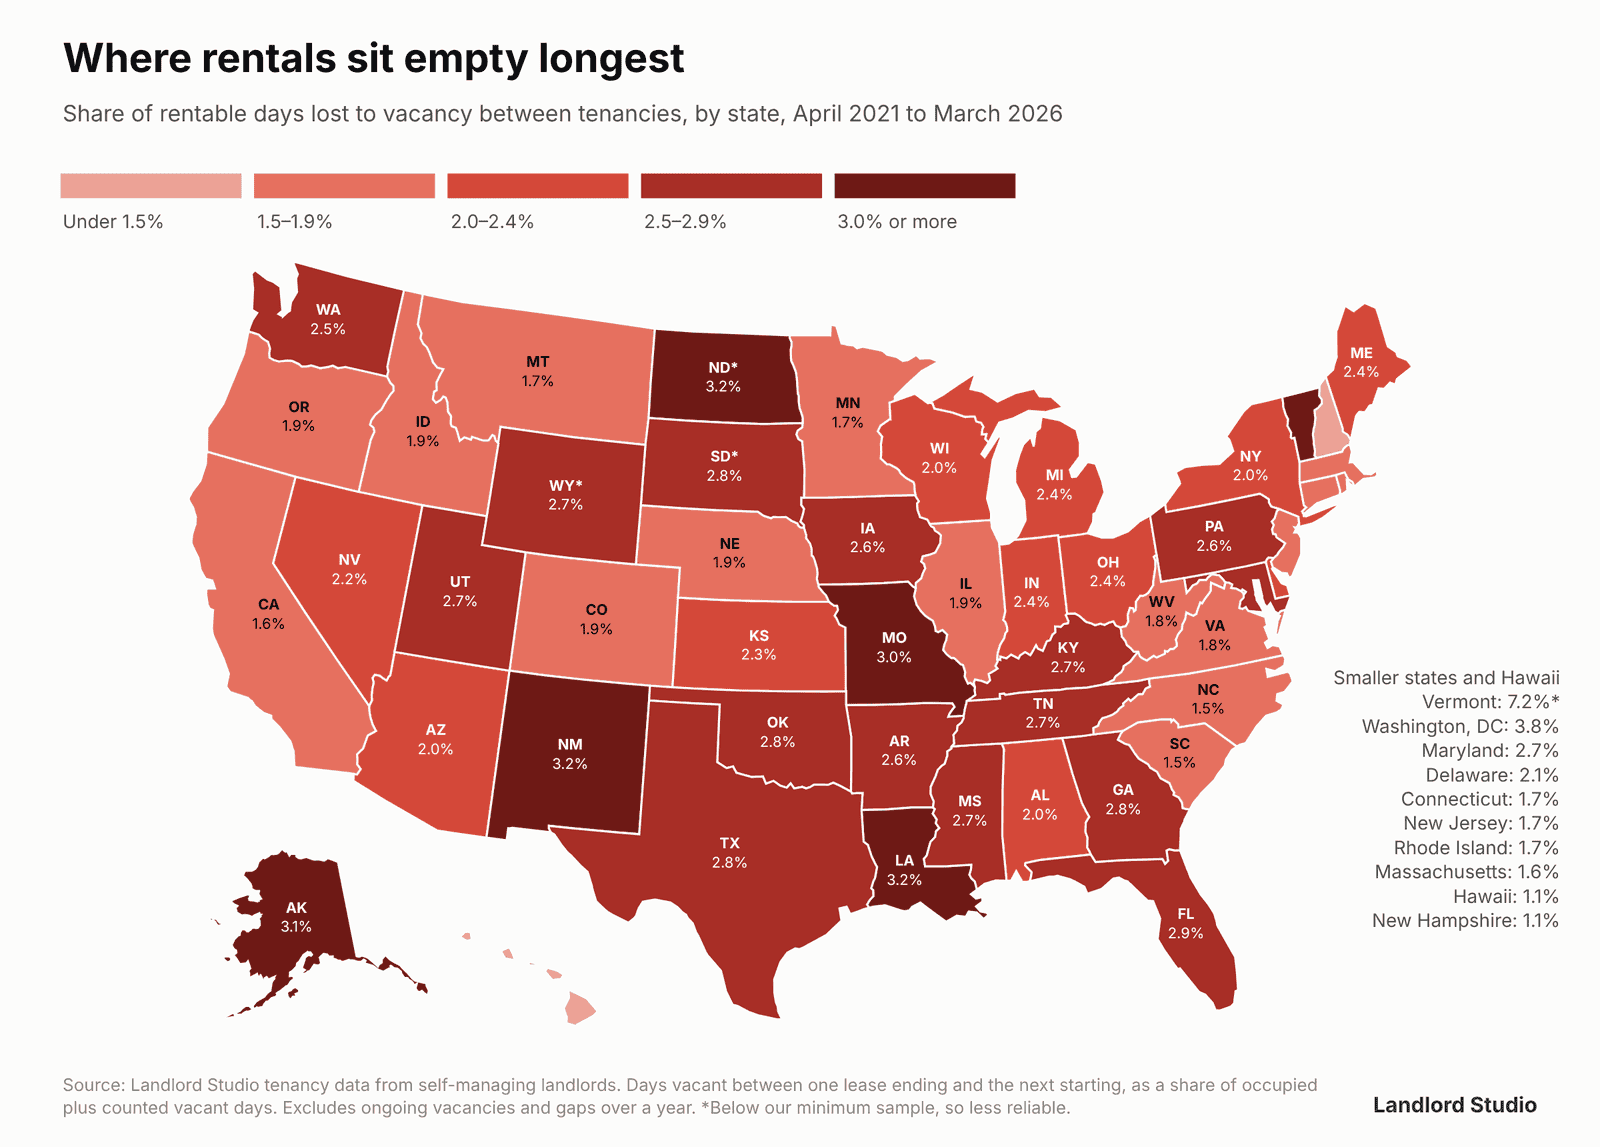
- Over the past five years, among states with enough data, Louisiana (3.2%), New Mexico (3.2%) and Alaska (3.1%) lost the most rentable days. Washington, DC is higher still, at 3.8%.
- Hawaii (1.1%), New Hampshire (1.1%) and South Carolina (1.5%) lost the fewest. Hawaii and South Carolina are the biggest outliers against the Census figures.
- Florida had the largest percentage-point increase in days vacant between 2021–23 and 2024–26, followed by Arizona and Indiana. Arizona's share more than tripled from a low base.
Are rental vacancy rates rising?
In our data, yes. Recorded vacancy has risen every year since 2021–22, from 1.7% to 2.7% of rentable days.
Vacancies are also lasting longer. The median vacancy was a month for two years running, then grew to 44 days by 2025–26.
The Census picture points the same way. Its national rental vacancy rate rose from 6.8% in 2024 to 7.1% in 2025.
Which states have the highest rental vacancy rates?
- Highest states: among states with enough data, Louisiana, New Mexico and Alaska lost the most rentable days to vacancy over the five years to March 2026, each above 3%.
- Washington, DC: higher still, at 3.8%, with a typical vacancy of 61 days.
- The table: all 50 states and DC. 46 states and DC are ranked on five years of data. North Dakota, South Dakota, Vermont and Wyoming are listed unranked at the bottom because they fall below our minimum sample.
- Two-year columns: April 2021 to March 2023, and April 2024 to March 2026.
Note: an asterisk (*) marks a figure below our minimum sample for that period (see methodology), so treat it with caution. Each period is measured separately, and 2023–24 falls in neither two-year column, so the five-year figure is not an average of the two. Ties are ranked on unrounded figures.
Two patterns stand out:
- Florida: frequent and long vacancies: the median Florida rental waits 44 days for its next tenant, and its share of days vacant more than doubled between 2021–23 and 2024–26.
- Maryland, Pennsylvania and New Jersey: fewer vacancies, but long ones. Their share of days vacant sits in the middle or lower half of the table, but when a home does empty, it stays vacant for a median 46 to 61 days.
Which states fill vacant rentals fastest?
Hawaii and New Hampshire lose the fewest rentable days to vacancy, at about 1.1%. South Carolina, North Carolina, Massachusetts and California follow, all at 1.6% or less.
A low share of days vacant does not always mean a quick turnaround. New Jersey, Massachusetts and California lose few days because homes there change tenants less often in our data. When a home in those states does empty, the median vacancy is 45 to 59 days.
Speed of re-renting tells a different story. Over the latest two years, Colorado re-rented 56% of its vacant rentals within 30 days, the highest share among states with enough data. Oregon followed at 52%, then Arizona, South Carolina and Washington at 48% to 49%. Washington, DC (23%) and Florida (30%) were the slowest.

Where is rental vacancy rising fastest?
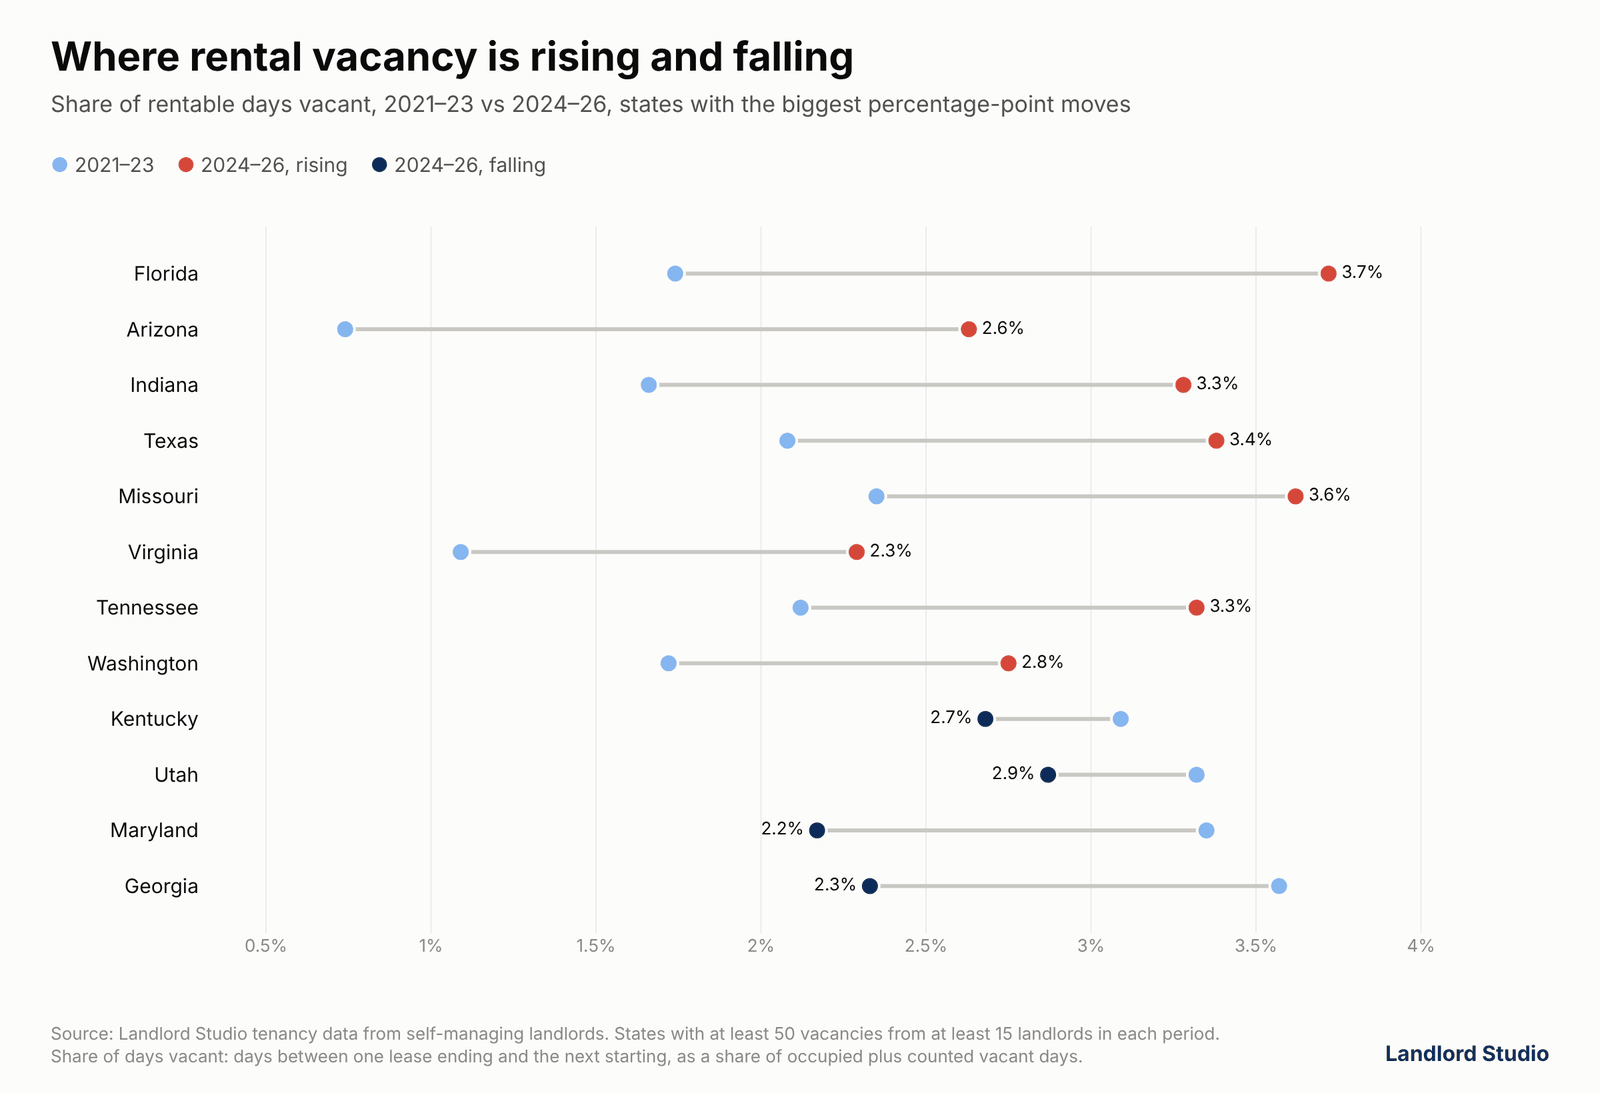
Vacancy rose in most states between 2021–23 and 2024–26. Among the 30 states with at least 50 vacancies from at least 15 landlords in each period, Florida had the largest percentage-point increase, from 1.7% to 3.7% of rentable days. Georgia and Maryland moved the other way.
Biggest increases (percentage points, share of days vacant, 2021–23 to 2024–26)
- Florida: 1.7% to 3.7%
- Arizona: 0.7% to 2.6%
- Indiana: 1.7% to 3.3%
- Texas: 2.1% to 3.4%
- Missouri: 2.3% to 3.6%
Falling
- Georgia: 3.6% to 2.3%
- Maryland: 3.4% to 2.2%
- Utah and Kentucky: both slightly lower
Mississippi and Colorado show bigger changes in the table, but on fewer vacancies, so they are left off these lists.
How does this compare with the Census rental vacancy rate?
Both show vacancy rising, and both put Florida, Louisiana and Missouri among the ten highest and California, Massachusetts and New Jersey among the ten lowest.
Two states stand out as outliers, where the two sources disagree most:
- South Carolina: Census puts its rental vacancy rate at 9.8%, one of the highest in the country. In Landlord Studio's data it is one of the lowest, at 1.5%.
- Hawaii: Census puts it at 8.7%, also among the highest. In our data it loses the fewest rentable days of any state, at 1.1%.
The gaps likely reflect what each source counts, not a real contradiction. Census covers all rental stock, including large apartment complexes. Our figures cover days between tenancies on homes independent landlords already rent out, and leave out short-term and vacation rentals.
When do rentals re-rent fastest?
Over the past five years, rentals that emptied in June filled fastest, with a median vacancy of 30 days and 51% re-rented within a month. Rentals that emptied in November waited a median 48 days.
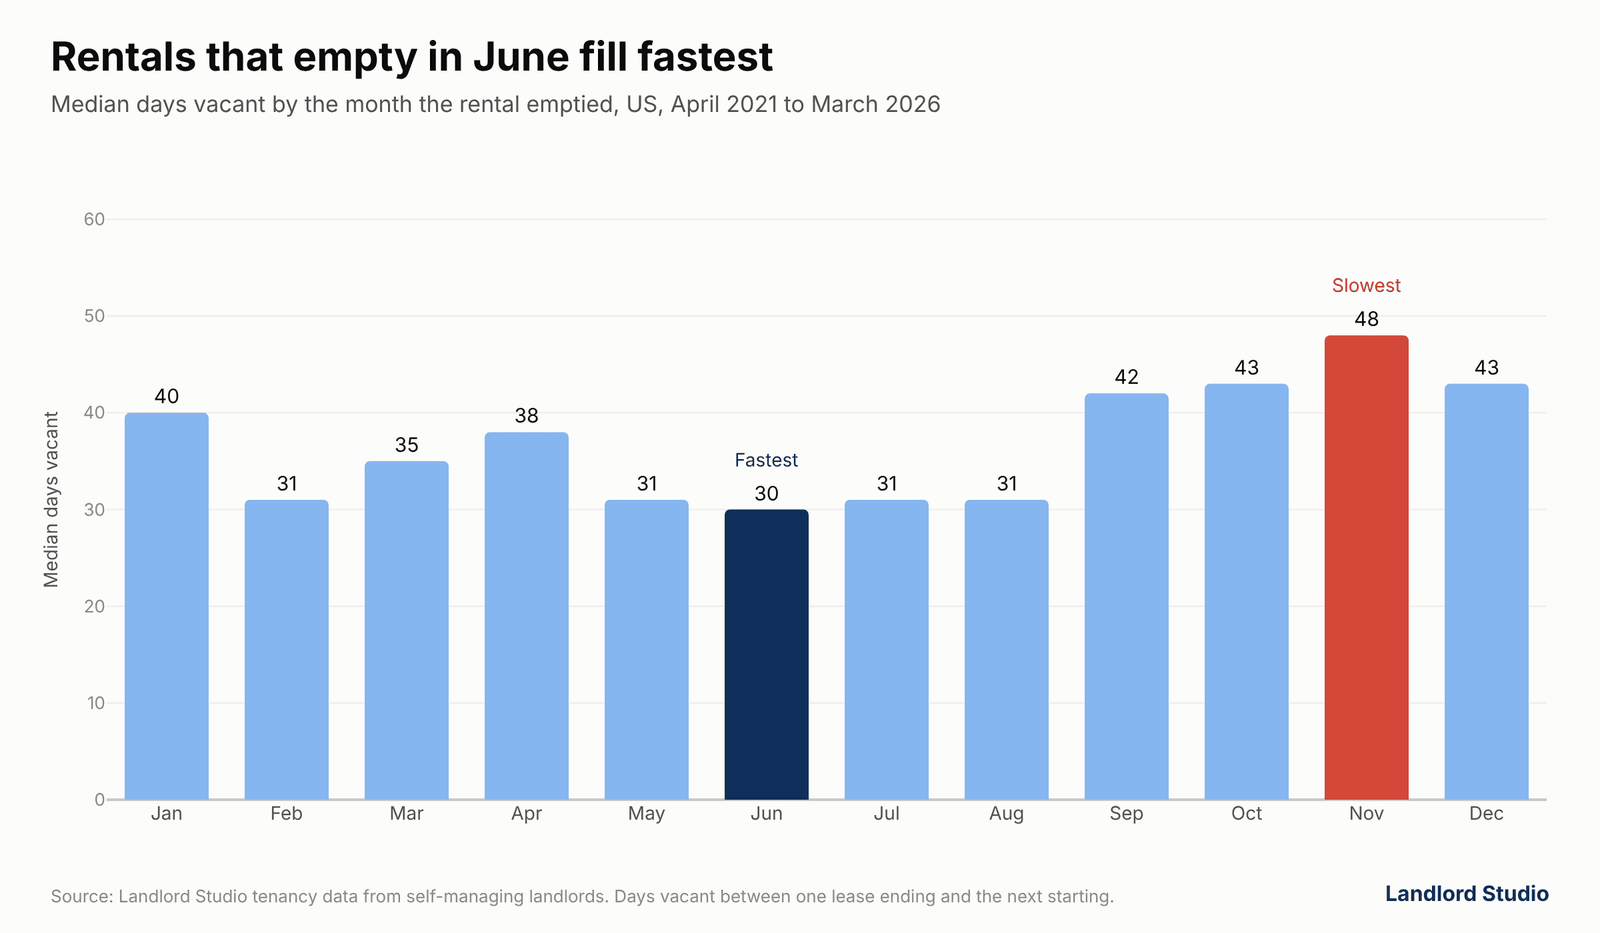
Move-outs peak between May and August, which account for about 39% of the move-outs in our data. Our guide to the best time to rent a house covers how to plan around the busy season.
Does the number of bedrooms change how long a rental stays vacant?
One-bedroom homes lose the most days to vacancy, at 3.5%. Homes with five or more bedrooms take longest to fill once empty, a median 42 days.
What is a good vacancy rate for a rental property?
If your rental had a vacancy, here is how it compares with others in Landlord Studio's data over the past five years:
- Most rentals had no recorded vacancy: about four in five rentals had no recorded vacancy between tenancies within our measurement rules.
- Compare with the median, not your state: state figures include those rentals, so if yours had a vacancy, use the 5.2% median as your benchmark.
- Check your own rate: our guide explains how to calculate vacancy rate, and the vacancy rate calculator does the sums for you. For ways to shorten the gap between tenants, see our guide to reducing tenant turnover and vacancies.
How much rent does a vacancy cost a landlord?
At the 2025–26 median of 44 days, a vacancy costs about a month and a half of rent. On a $2,000 monthly rent, that is roughly $2,900, before any cleaning, repairs or marketing between tenants. Averaged across all homes, including those with no vacancy, it works out at about 10 days of rent a year.
Keep the gap between tenants short
The typical vacancy now lasts more than six weeks, and fall move-outs take longer. With Landlord Studio's online rent collection, you can collect rent online and keep every lease and payment for your properties in one place.
Methodology
Most rental vacancy rates you see quoted come from the Census Bureau. Census measures the share of all rental homes that are vacant and for rent, averaged over the year, including large apartment complexes. That tells you about the market. It does not tell a small landlord how long their own home is likely to stay vacant when a tenant leaves.
So we measured the gaps between tenancies instead. This analysis uses anonymized tenancy records for long-term rental homes managed by self-managing landlords in Landlord Studio, from April 2021 to March 2026. Leases and rent records up to October 2026 were used to confirm whether a vacancy had ended.
How we define vacant
- Counted: days a home sat empty between one tenancy ending and the next starting, on homes that are being rented out. The share of days vacant is those days as a share of occupied days plus counted vacant days.
- Not counted: days before a home's first tenancy or after its last, vacancies still open in October 2026, and gaps longer than a year, which are more likely renovation, owner use or a sale.
- Quiet gaps: where a gap ran past 90 days with no activity on the landlord's account, and the next lease was only entered after it had started, we can't confirm the home was empty. Days after the first 90 are left out of the calculation. This affected less than 0.1% of rentable days.
- What that means: these exclusions may understate vacancy rates and durations.
Other details
- Days vacant: the number of days between one tenancy ending and the next one starting. Lease records were checked against logged rent payments, so tenancies that ran past their end date, or ended early, are measured from the payments.
- Deleted records: homes and tenancies that landlords later deleted from Landlord Studio are kept for the period they were let.
- Other exclusions: short-term and vacation rentals, and homes with no rent recorded during the period.
- Periods: national trend figures are for each year from April to March. The state ranking uses April 2021 to March 2026.
- Minimum sample size: we only report regional figures where there is enough data, and aim to exclude long-term empty homes to focus on gaps between tenancies.
- Re-rented within 30 days: the next lease started 30 days or fewer after the previous one ended.
- Census comparison: US Census Bureau Housing Vacancy Survey, 2025 annual rental vacancy rates by state. Census notes that its 2025 estimates are based on 11 months of data, because October 2025 data was not collected. The rank correlation between our state ranking and Census rates is 0.45.