



Vacancy Rate Calculator
Work out your true vacancy rate, what it's costing you in dollars, and how you compare to the local market - using free US Census and Zillow data.

How to manually calculate your vacancy rate
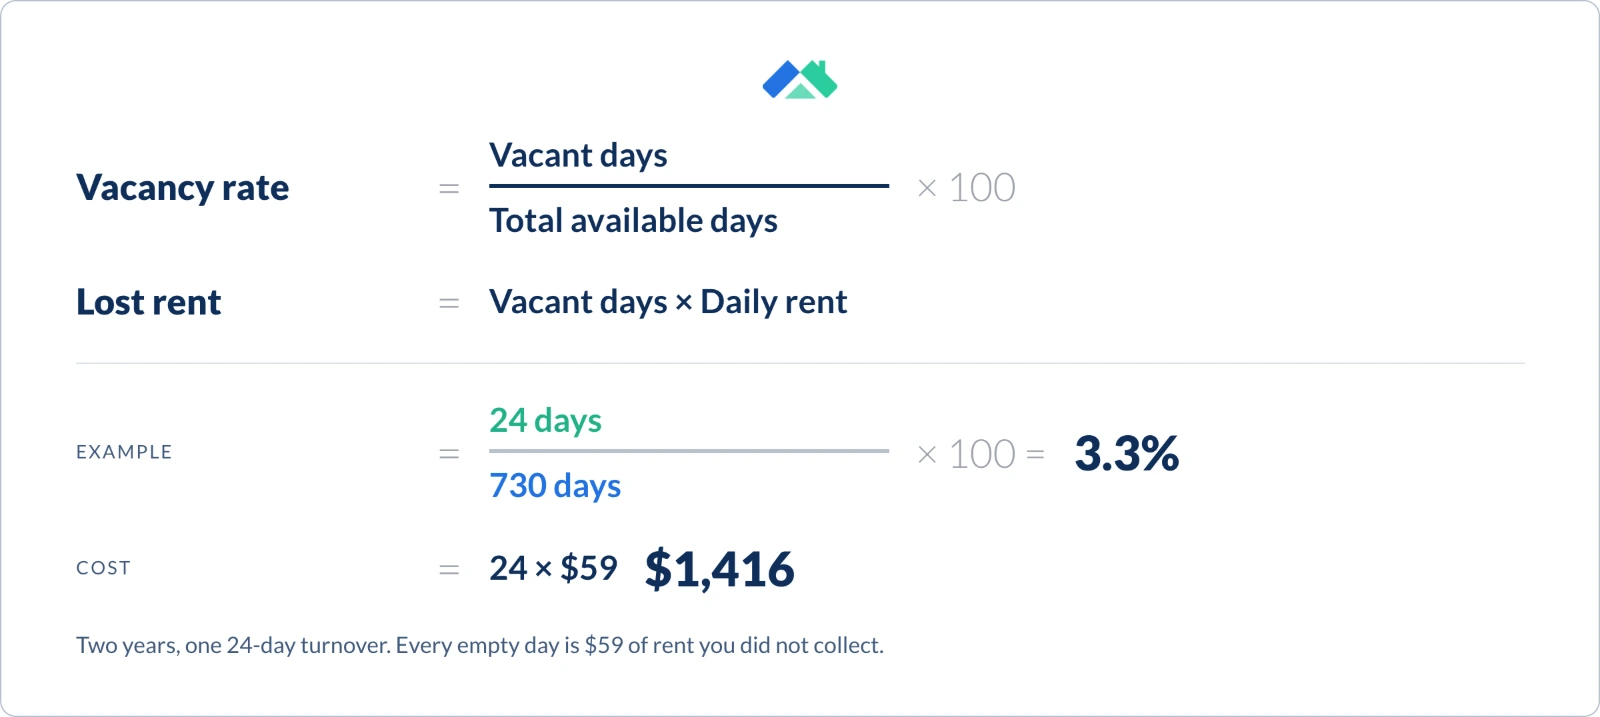
Vacancy rate is vacant days divided by total available days, times 100. Multiply the vacant days by your daily rent and you get what it actually cost.
Count your vacant days
Every day the unit was available but not producing rent, including turnover time.
Divide by total available days
Use a full year or a multi-year window, since a single turnover skews a short period.
Multiply the vacant days by daily rent
That dollar figure is usually more persuasive than the percentage.
Worked example
One 18-day turnover across a full year, on a unit renting for $1,825 a month.
Vacancy rate = (18 ÷ 365) × 100 = 4.9%
Cost of vacancy = 18 × $60 = $1,080

Other calculators you might be interested in

Net Operating Income Calculator
Feed your vacancy rate into NOI to see what the property really earns.

Rental Yield Calculator
Gross and net yield, cash flow and cash-on-cash return on a rental property.

Free Mileage Calculator
Log property trips, apply the IRS standard mileage rate, and download a tax-ready expense pack.

Manage up to 3 rental properties for free!
Sign up and get PRO free for 14 days. When the trial ends, keep tracking rent, expenses and reports for up to 3 properties, free forever with Landlord Studio GO.
By continuing you agree to our Terms & Conditions. · Already have an account? Log in
Understanding your vacancy rate
Vacancy Rate Calculator
A vacancy percentage on its own is abstract. Converted to dollars it's a line item you can compare against a price cut, a leasing fee or a faster turnover - and usually the vacancy costs more than the fix.
Benchmarked against real market data
Your rate only means something next to your market. This tool benchmarks against US Census Housing Vacancy Survey data for your state and compares your rent to the typical rent in your ZIP from Zillow's rent index.

Why should you use our vacancy rate calculator?
- Turns your vacancy rate into a dollar cost you can act on
- Benchmarks against US Census data for your state, not a rule of thumb
- Compares your rent to the typical rent in your ZIP
- Flags college-town seasonality that skews turnover
- Free, fast and no sign-up to see your rate
FAQs
How do you calculate a vacancy rate?

Divide total vacant unit-days by total available unit-days over the period, then multiply by 100. Two units empty for 15 days each is 30 vacant unit-days, the same as one unit empty for 30.
The subtlety is what counts as available. Most landlords count a unit as vacant only when it's on the market and being marketed - not when it's pulled off-market for renovation.
What is a good vacancy rate?
It depends heavily on your market and property type - a college-town apartment turns over far more than a suburban single-family home. The US Census Housing Vacancy Survey publishes state and national rental vacancy rates each quarter, which is a better benchmark than any rule of thumb.
The more useful question is what vacancy is costing you in dollars, and whether it's trending the right way.
Why is my rental sitting vacant?
The most common causes are pricing above the market, slow turnover between tenants, and weak marketing. Pricing is usually the biggest lever - a unit listed 5% over the local median can sit for weeks, which costs far more than the extra rent would have earned.
Comparing your rent against the typical rent in your ZIP is the fastest way to find out whether price is the problem.