




Read summarized version with:

ChatGPT

Gemini

Claude

Grok

Add as preferred on Google
Key findings
A single-unit rental costs landlords about $2,500 a year to maintain, or 11.4% of rent. That's based on the repair and maintenance costs self-managing landlords logged in Landlord Studio from 2023 to 2025.
- Median spend: about $850 a year per single-unit rental, well below the average.
- All rental units: about $1,950 per unit a year, including apartments in multi-unit buildings.
- Highest and lowest share: Alabama (23.0% of rent) and Colorado (8.3%), among the 23 states with enough data to compare.
- Repair bills vary less than rent: across those 23 states, the highest-spending state spends 2.0 times the lowest, while the highest rent is 3.0 times the lowest.
- Bigger homes cost more: about $1,840 a year for one bedroom, rising to $3,520 for five bedrooms or more.
- Plumbing costs the most: it takes the largest share of named spending, while lawn, landscaping and snow work comes up most often.
How much does rental property maintenance cost in each state?
The table ranks all 50 states and DC by maintenance as a share of rent, for single-unit homes.
* Starred states have fewer than 200 rental years or 40 landlords, so treat their figures as a rough guide. The state comparisons in this article use the 23 unstarred states. Percentages compare recorded annual maintenance with annualized contract rent, not rent collected. Ranked on unrounded percentages. Medians are rounded to the nearest $10.

Which states spend the most of their rent on maintenance?
Of the unstarred states, Alabama, North Carolina and Indiana spend the largest share of rent on maintenance, at 23.0%, 16.3% and 15.5%.
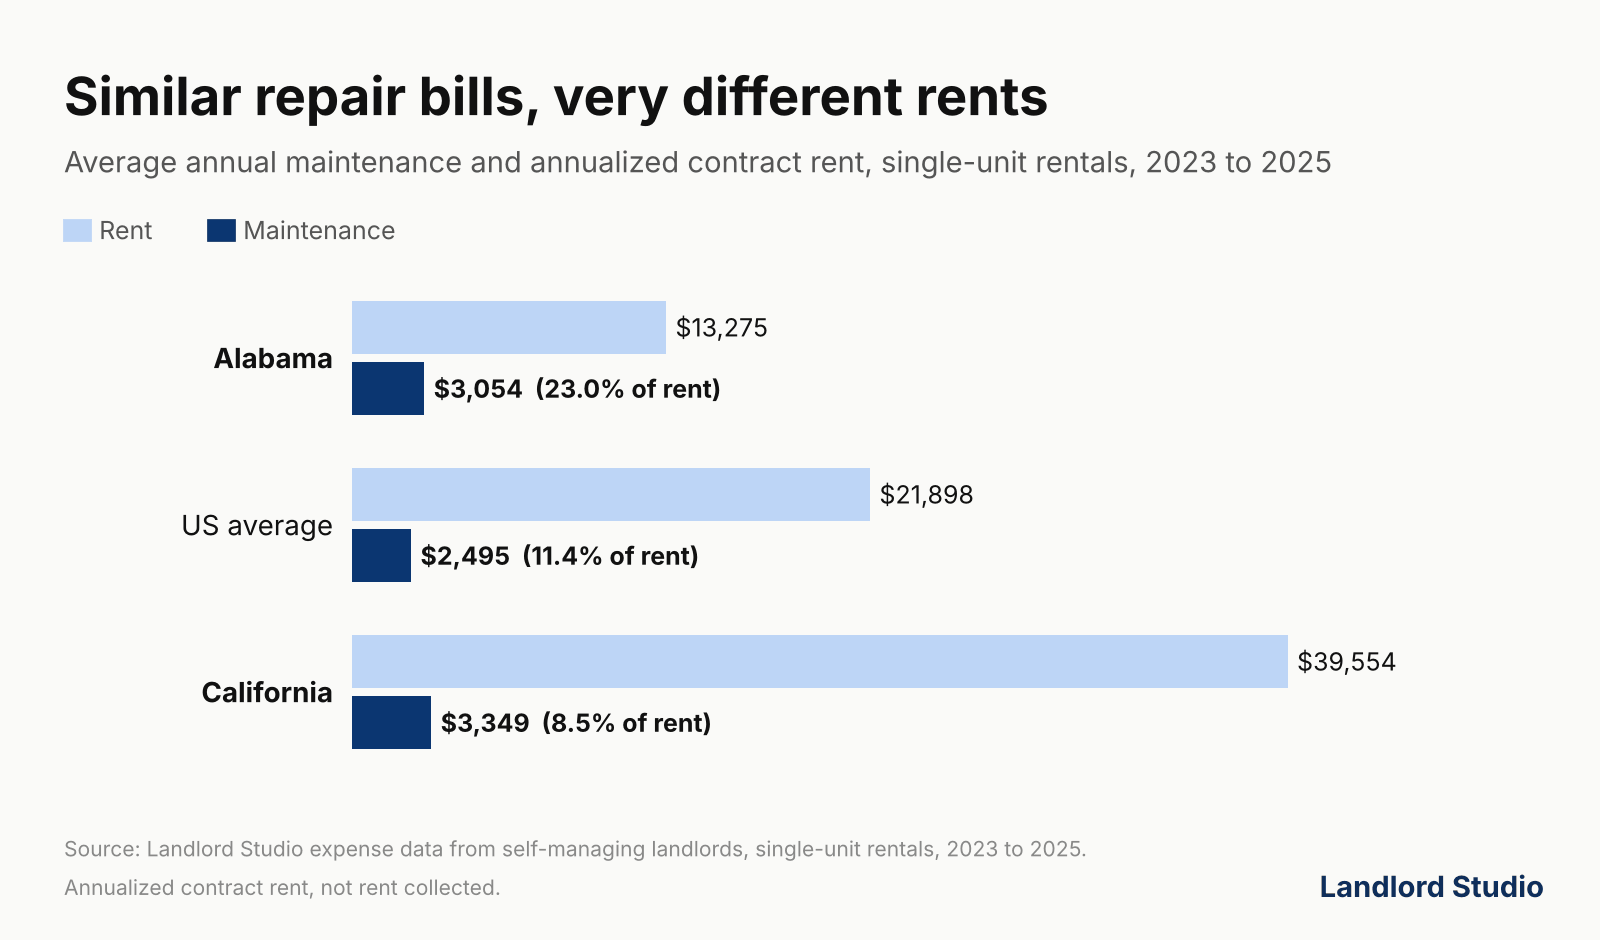
- Alabama: landlords spend $3,054 a year, about the same as in Texas, but on an average rent of $13,275, so maintenance takes almost $1 in every $4.
- Low rents, normal repair bills: most high-share states have average rents under $20,000 a year, yet spend $1,983 to $3,122 on maintenance, close to the $2,495 national average.
- Texas is the exception: both its rent ($22,993) and its maintenance ($3,084) are above average.
Which states spend the least of their rent on maintenance?
At the other end, Colorado, California, Washington, Maryland and Illinois spend the smallest share. Their landlords spend $2,283 to $3,349 a year, but on average rents above $24,000. California spends more on maintenance than any other unstarred state, yet it takes just 8.5% of rent.
Why does maintenance take a bigger share of rent in cheaper states?
Repair bills vary far less between states than rent does. Rent in California is about three times Alabama's ($39,554 against $13,275 a year), but maintenance is only about 10% higher ($3,349 against $3,054).
Repair bills don't fall in step with rent, so maintenance takes a bigger share of rent in cheaper states. Property age, size and condition may also play a part.
How much does rental maintenance cost by number of bedrooms?
Costs rise with size, from about $1,840 a year for a one-bedroom home to $3,520 for five bedrooms or more. As a share of rent, two- and three-bedroom homes cost the most, at 12.5%.
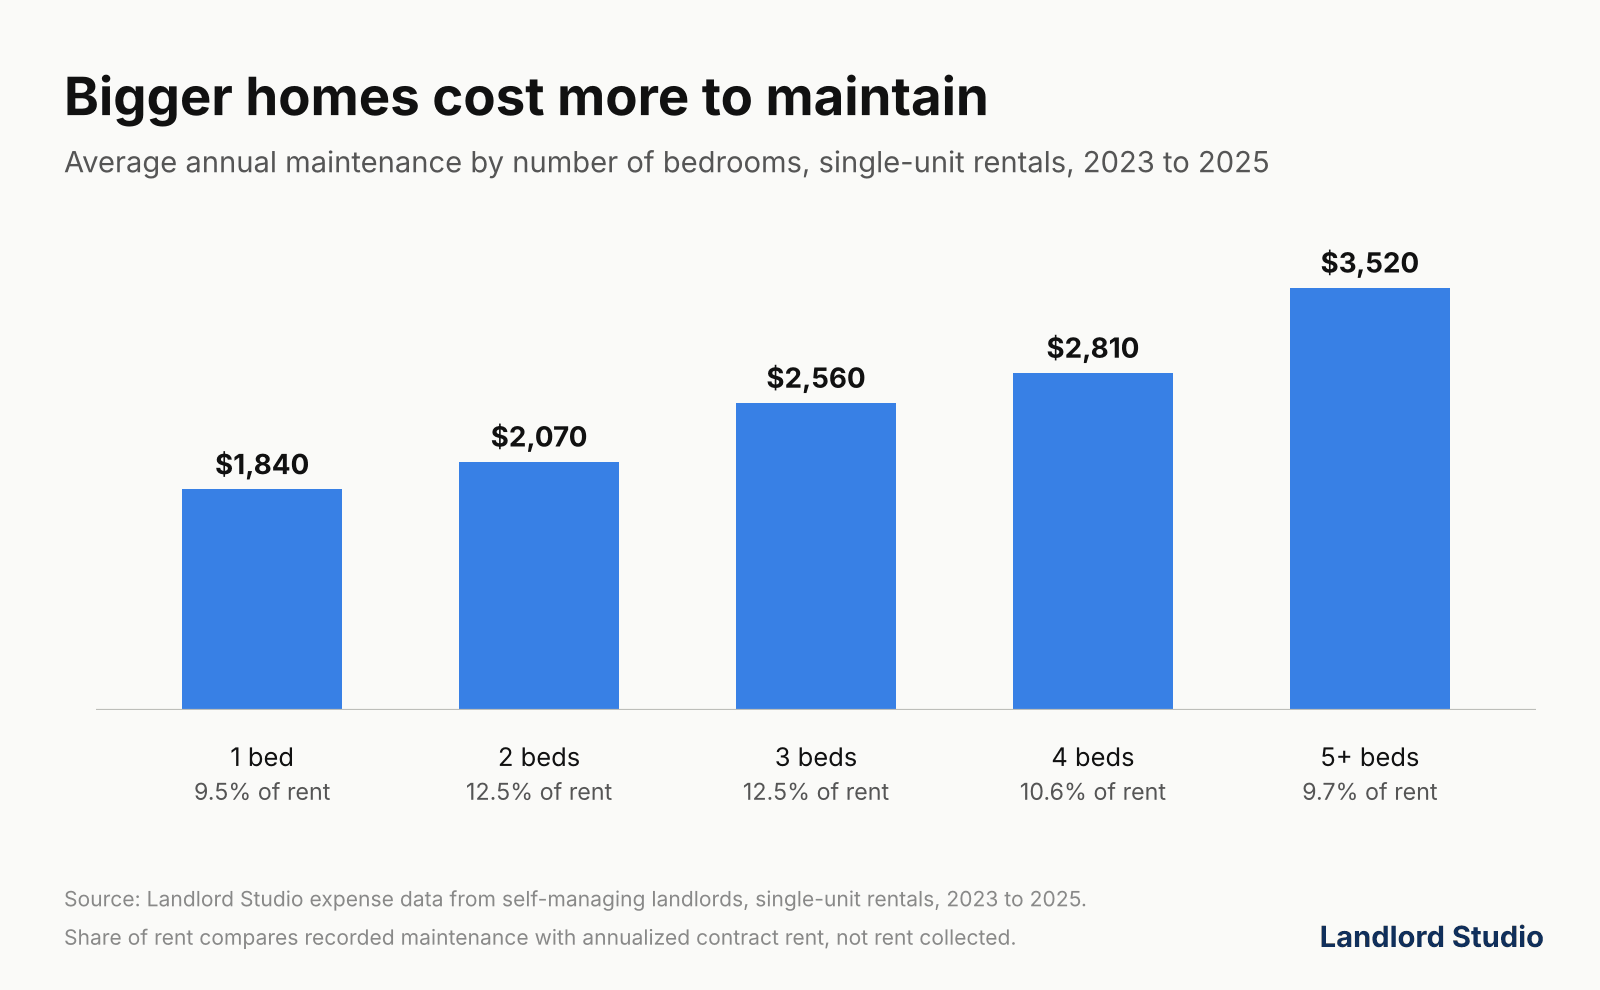
Averages sit well above medians at every size, suggesting that higher-cost years pull up average spending. About 1 in 5 rental years had no maintenance costs logged.
What do landlords spend maintenance money on?
Plumbing takes the largest share of named maintenance spending, at 17.4%. Lawn, landscaping and snow work is the most frequent expense, at about a quarter of named entries.
These figures cover about half of maintenance spending, the part where the expense description names the type of work.
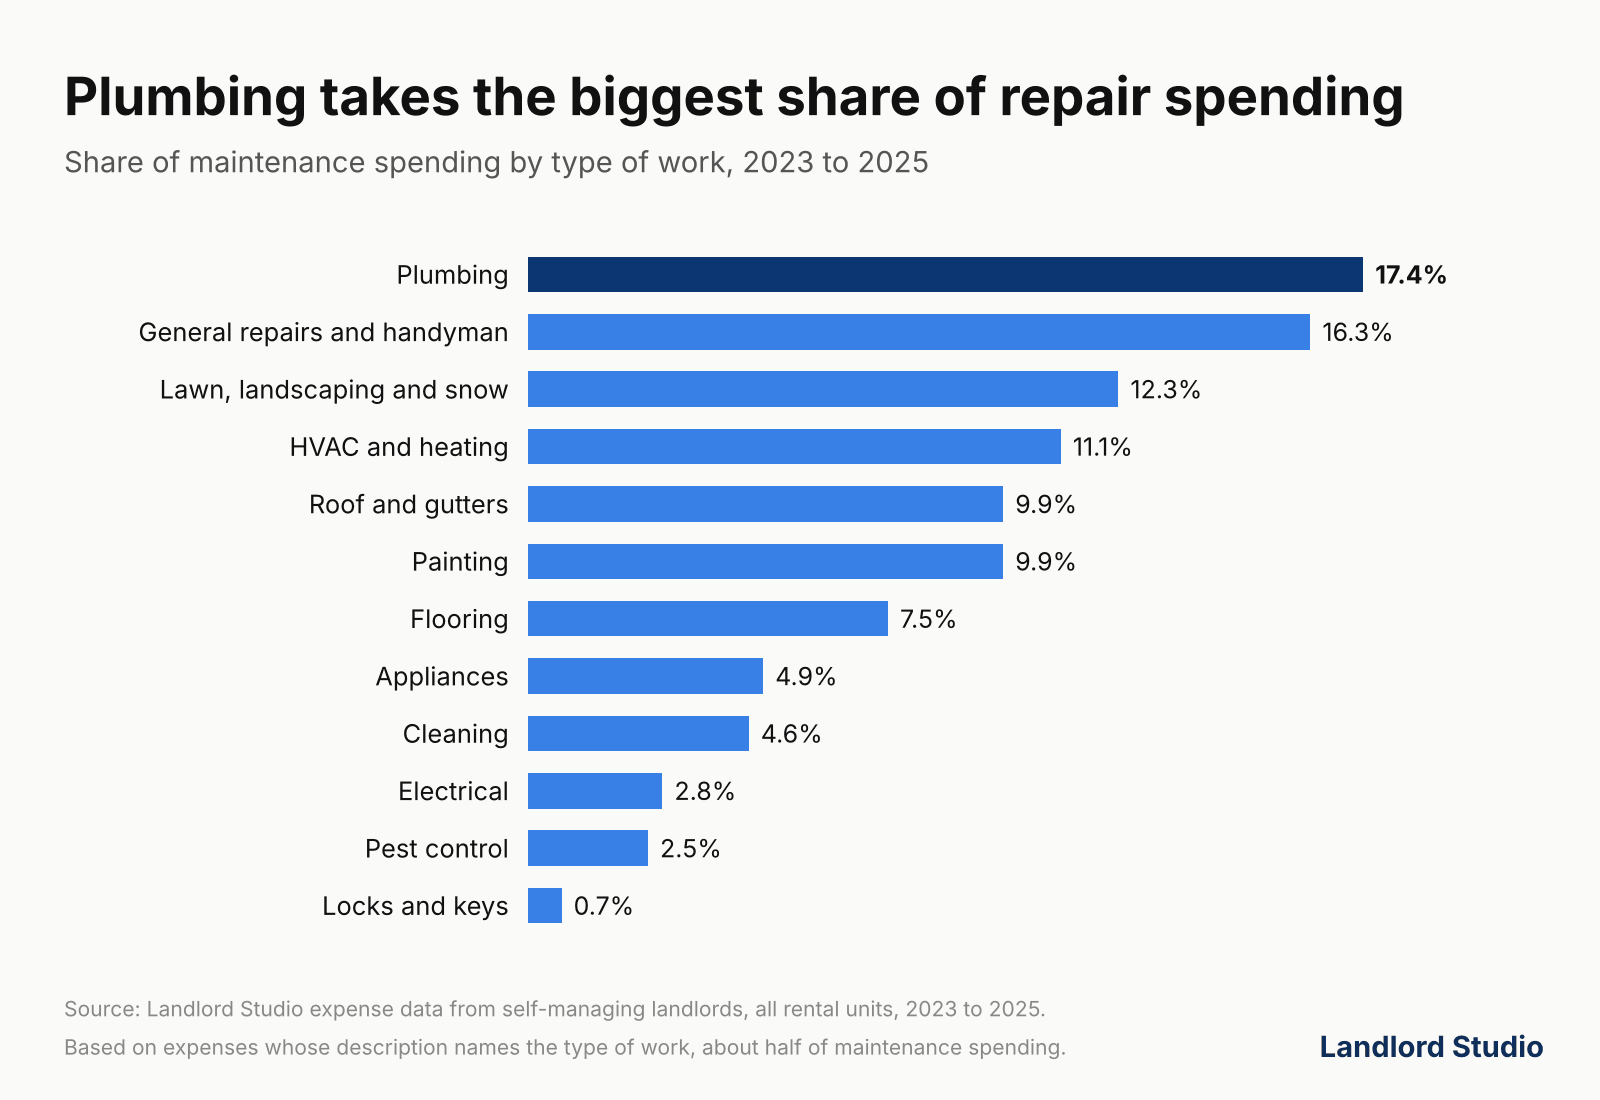
Roof and gutter work is rare but expensive: 2.8% of entries, but 9.9% of spending. Pest control is the opposite, frequent and cheap.
How much should you budget for rental property maintenance?
Budget 11.4% of rent for repairs and maintenance, or your state's figure if it isn't starred. On a $2,000-a-month rent, that's about $2,740 a year.
Adjust it for your property's age, condition and upcoming work. Keep a separate reserve for major replacements, because these averages exclude single repairs over $25,000 and cap the top 1% of yearly totals.
The budget doesn't cover capital improvements such as a renovation, which are taxed differently from repairs. For a fuller breakdown, see our list of rental property maintenance expenses.
How does this compare with other maintenance estimates?
Our figures sit well below popular homeowner estimates. Studies of rentals come closer, though each defines maintenance differently.
- Homeowner estimates: Bankrate's 2025 study puts the annual maintenance budget for a single-family home at $8,808, because it estimates maintenance as 2% of each state's median sale price.
- Census and HUD: an analysis of the Rental Housing Finance Survey puts single-unit rental maintenance at a median $1,800 per unit in 2023 among owners who reported it, about 8% of rent.
- Our median without zero years: leaving out years with no maintenance logged raises our median from $850 to about $1,400.
- Property managers: Bay Property Management Group's repair data lists landscaping, pest control and appliances among the most common repair requests, in line with what landlords log in Landlord Studio.
- Broader budgets: the 50% rule includes property taxes, insurance and other operating costs, while our 11.4% covers repairs and maintenance only.
Methodology
Most maintenance figures are homeowner estimates based on home value. We used what landlords actually spent: anonymized maintenance and repair costs logged by self-managing landlords in Landlord Studio for long-term rental homes, January 2023 to December 2025, matched to each home's rent.
- Maintenance: paid expenses in the repair, maintenance and cleaning categories and trades such as plumbing, HVAC, landscaping, pest control and roofing, excluding utilities, capital improvements, renovations and costs paid by tenants.
- Landlord-entered records: we count expenses the landlord entered, edited or reconciled, and leave out automatic records nobody reviewed.
- Per home, per year: costs are totaled for each home for each calendar year, with building-level costs split across the units in multi-unit buildings.
- Single-unit rentals: state and bedroom figures use properties with one rental unit, such as a house, so shared building costs don't distort the comparison.
- Active tracking: a year counts only if the landlord entered expenses of any kind in at least three quarters of it, both across their account and for that home.
- Long-term lets: the home must have had a long-term tenancy that year, so short-stay homes are excluded and we aim to leave out homes left empty long-term.
- Zero years: years with no maintenance logged are kept.
- Outliers: single expenses over $25,000 are excluded as likely capital work or data errors, and the top 1% of yearly totals are capped.
- Maintenance as % of rent: calendar-year maintenance compared with annualized contract rent, not rent collected, so a home let for part of the year is still compared with a full year's rent.
- Missing rent: years with no recorded rent are left out of all single-unit figures.
- States: all 50 states and DC appear in the table, and states with fewer than 200 rental years or 40 landlords are starred and left out of the state comparisons.
- Type of work: from expense descriptions that name the job, across all rental units.