A rental property income statement is one of the most important reports for real estate investors. If a property is under or overperforming, a rental property income statement is central to understanding why. Additionally, a real estate income statement will report net operating income (NOI) which is a key figure used in important real estate financial metrics such as cap rate and debt service coverage ratio (DSCR).
In this article, we take a closer look at what a real estate income statement is, how landlords and investors can create a report that works for them, and how the report can be used to help you achieve and maintain a profitable rental portfolio.
Key Takeaways
The rental income statement (also known as a profit and loss or income expense statement) is a financial report used by landlords that shows a breakdown of all income and expenditures and the current NOI over a set period of time.
The three main parts to a rental income statement include, gross income, operating expenses, and net operating income.
The rental income statement can be used for tax purposes a well as to identify overdue rent payments and areas of overspend.
Creating an accurate rental income statement is essential for understanding your property's financial performance. The easiest way to create one is to use software like Landlord Studio.
What is a real estate income statement?
Also known as a profit and loss statement (P&L) or income expense statement, a real estate income statement lists all of the income and expenses associated with your property over a specified period of time. The report should beak down your portfolio by property and show both the total operating expenses and the gross income to highlight total profits.
Information on a real estate income statement includes:
Gross rental income
Additional income (such as pet rent, late fees, or roommate rent)
Operating expenses (including property management fees, repairs, and landscaping)
What is included on a rental property income statement?
Your real estate income statement displays three main pieces of data, the gross monthly income, the total operating expenses, and the net operating income.
Gross Monthly Income
Your gross income isn't just the rental income. It also includes other revenue sources you might have such as:
Monthly rental income
Other income sources
Pet rent
Appliance rent
Laundry usage
Storage
Parking
Late fees
Application fees
Operating Expenses
Operating expenses include all the necessary and routine expenses required for the day to day running of your rental property. It's important that you understand the difference between operating vs capital expenses and how to handle each.
Monthly operating expenses
Advertising
Cleaning
Electric
Gas
HOA dues
Insurance
Landscaping & snow removal
Leasing commissions
Legal & professional fees
Licenses
Mortgage interest
Other interest (such as credit card)
Pest control
Property management
Property tax
Rental tax
Repairs & maintenance
Trash
Utilities
Water & sewer
Owner expenses attributable to property management
NOI is your total income minus your operating expenses. It excludes non-operating costs, for example mortgage interest, depreciation, and capital expenses.
NOI can be used when calculating core investment metrics like cap rate, which helps measure the return a rental property can generate, and DSCR which shows how much debt the property’s income can support.
Your monthly income statement allows you to analyze your portfolio performance on a month-to-month basis. This month-to-month report will allow you to easily spot any unexpected overheads, and closely monitor cash flow on an ongoing basis to identify income and expense trends over a longer time period.
Year-to-date (YTD)
Your year-to-date (or YTD) profit and loss statement shows your total income, current accrued expenses, and total net operating income from the beginning of the tax or calendar year to the date the report was run. This is a useful report to analyze your property’s overall performance and to give you an indicator of current taxable income.
Year-end
A year-end income statement for rental property is a report that shows the total income, expenses, and NOI for the tax year. This is usually generated at the end of the year and used to help compile tax returns and update any important rental property portfolio performance indicators such as cap rate.
Trailing 12 months (T-12 statement)
When talking about abbreviations, the TTM statement or sometimes T12 statement tends to come up a lot. TTM, or T12, stands for “trailing twelve months” and generally refers to a financial statement that represents the entity’s performance over the past year from the current date.
A trailing 12-month report is used to monitor the change in NOI over the previous 12 months. A property’s T12, along with its rent roll and T3 (trailing 3-month financial statement) are some of the most important forms of documentation that a borrower will need to show a lender.
An example of rental property income statement calculations
In order to better understand how a rental property income statement works and can be used, let’s review an example.
For this example, we will look at a T12 real estate income statement for a single-family rental home. The purchase price is $200,000 with a 20% deposit and a monthly income of $2000.
It’s important to correctly classify and itemize all of your income and expenses to ensure you get the most practical use out of your report and use it to accurately and easily file your tax return. However, for the sake of simplicity, we have consolidated some of the example income and expenses.
$24,000 Income – $15,400 Operating Expenses – $2,730 Owner Expenses = $5,870 Net Operating Income (NOI)
Important metrics that utilize NOI
Cap rate
The capitalization rate is a good way to quickly calculate the potential of a property based on estimated numbers. The cap rate is a measurement of the rate of return on an investment property.
The lower the cap rate of a property, the slower the return will be. It takes into account the total (expected) income and the property’s current market value. The cap rate formula is a good one to take into account when comparing like-for-like investments in a single market.
Cap Rate = NOI / Property Value
Debt service coverage ratio (DSCR)
The Debt Service Coverage Ratio (DSCR) is used by lenders to determine the ability of a company, or loan applicant, such as a landlord, to repay all of its debt obligations. This includes repayment of the principal and interest on both short and long-term debt.
DSCR = Total Debt Service / Net Operating Income
Understanding your depreciation expense
The IRS allows owners of residential property used for investment purposes to depreciate the property value (excluding the land or lot value) over a period of 27.5 years.
To calculate total taxable income, subtract depreciation expense from your net operating income.
For example, let’s say the property value in the example above, minus the value of the land is $140,000, then the total annual depreciation would be approximately $5090. As the NOI is $5,870, the total taxable net income would be $780.
Automate your Rental Property Tracking and Income/ Expense Statements
In order to generate an accurate rental property income statement, whether this is an end-of-year report, a T12 statement, or a monthly statement, you need to keep detailed and careful records of all of your income and expenses throughout the year.
Using spreadsheets for rental income and expense tracking leaves a lot to be desired. It requires constant, time-consuming manual data entry and more often than not leads to accounting errors and missed expenses which could end up costing you hundreds, if not thousands, of dollars each year. And getting your data out of a spreadsheet and generating an income expense statement is almost impossible.
Thankfully, there are real estate accounting software on the market today that are designed to make this easier, less time-consuming, and more accurate.
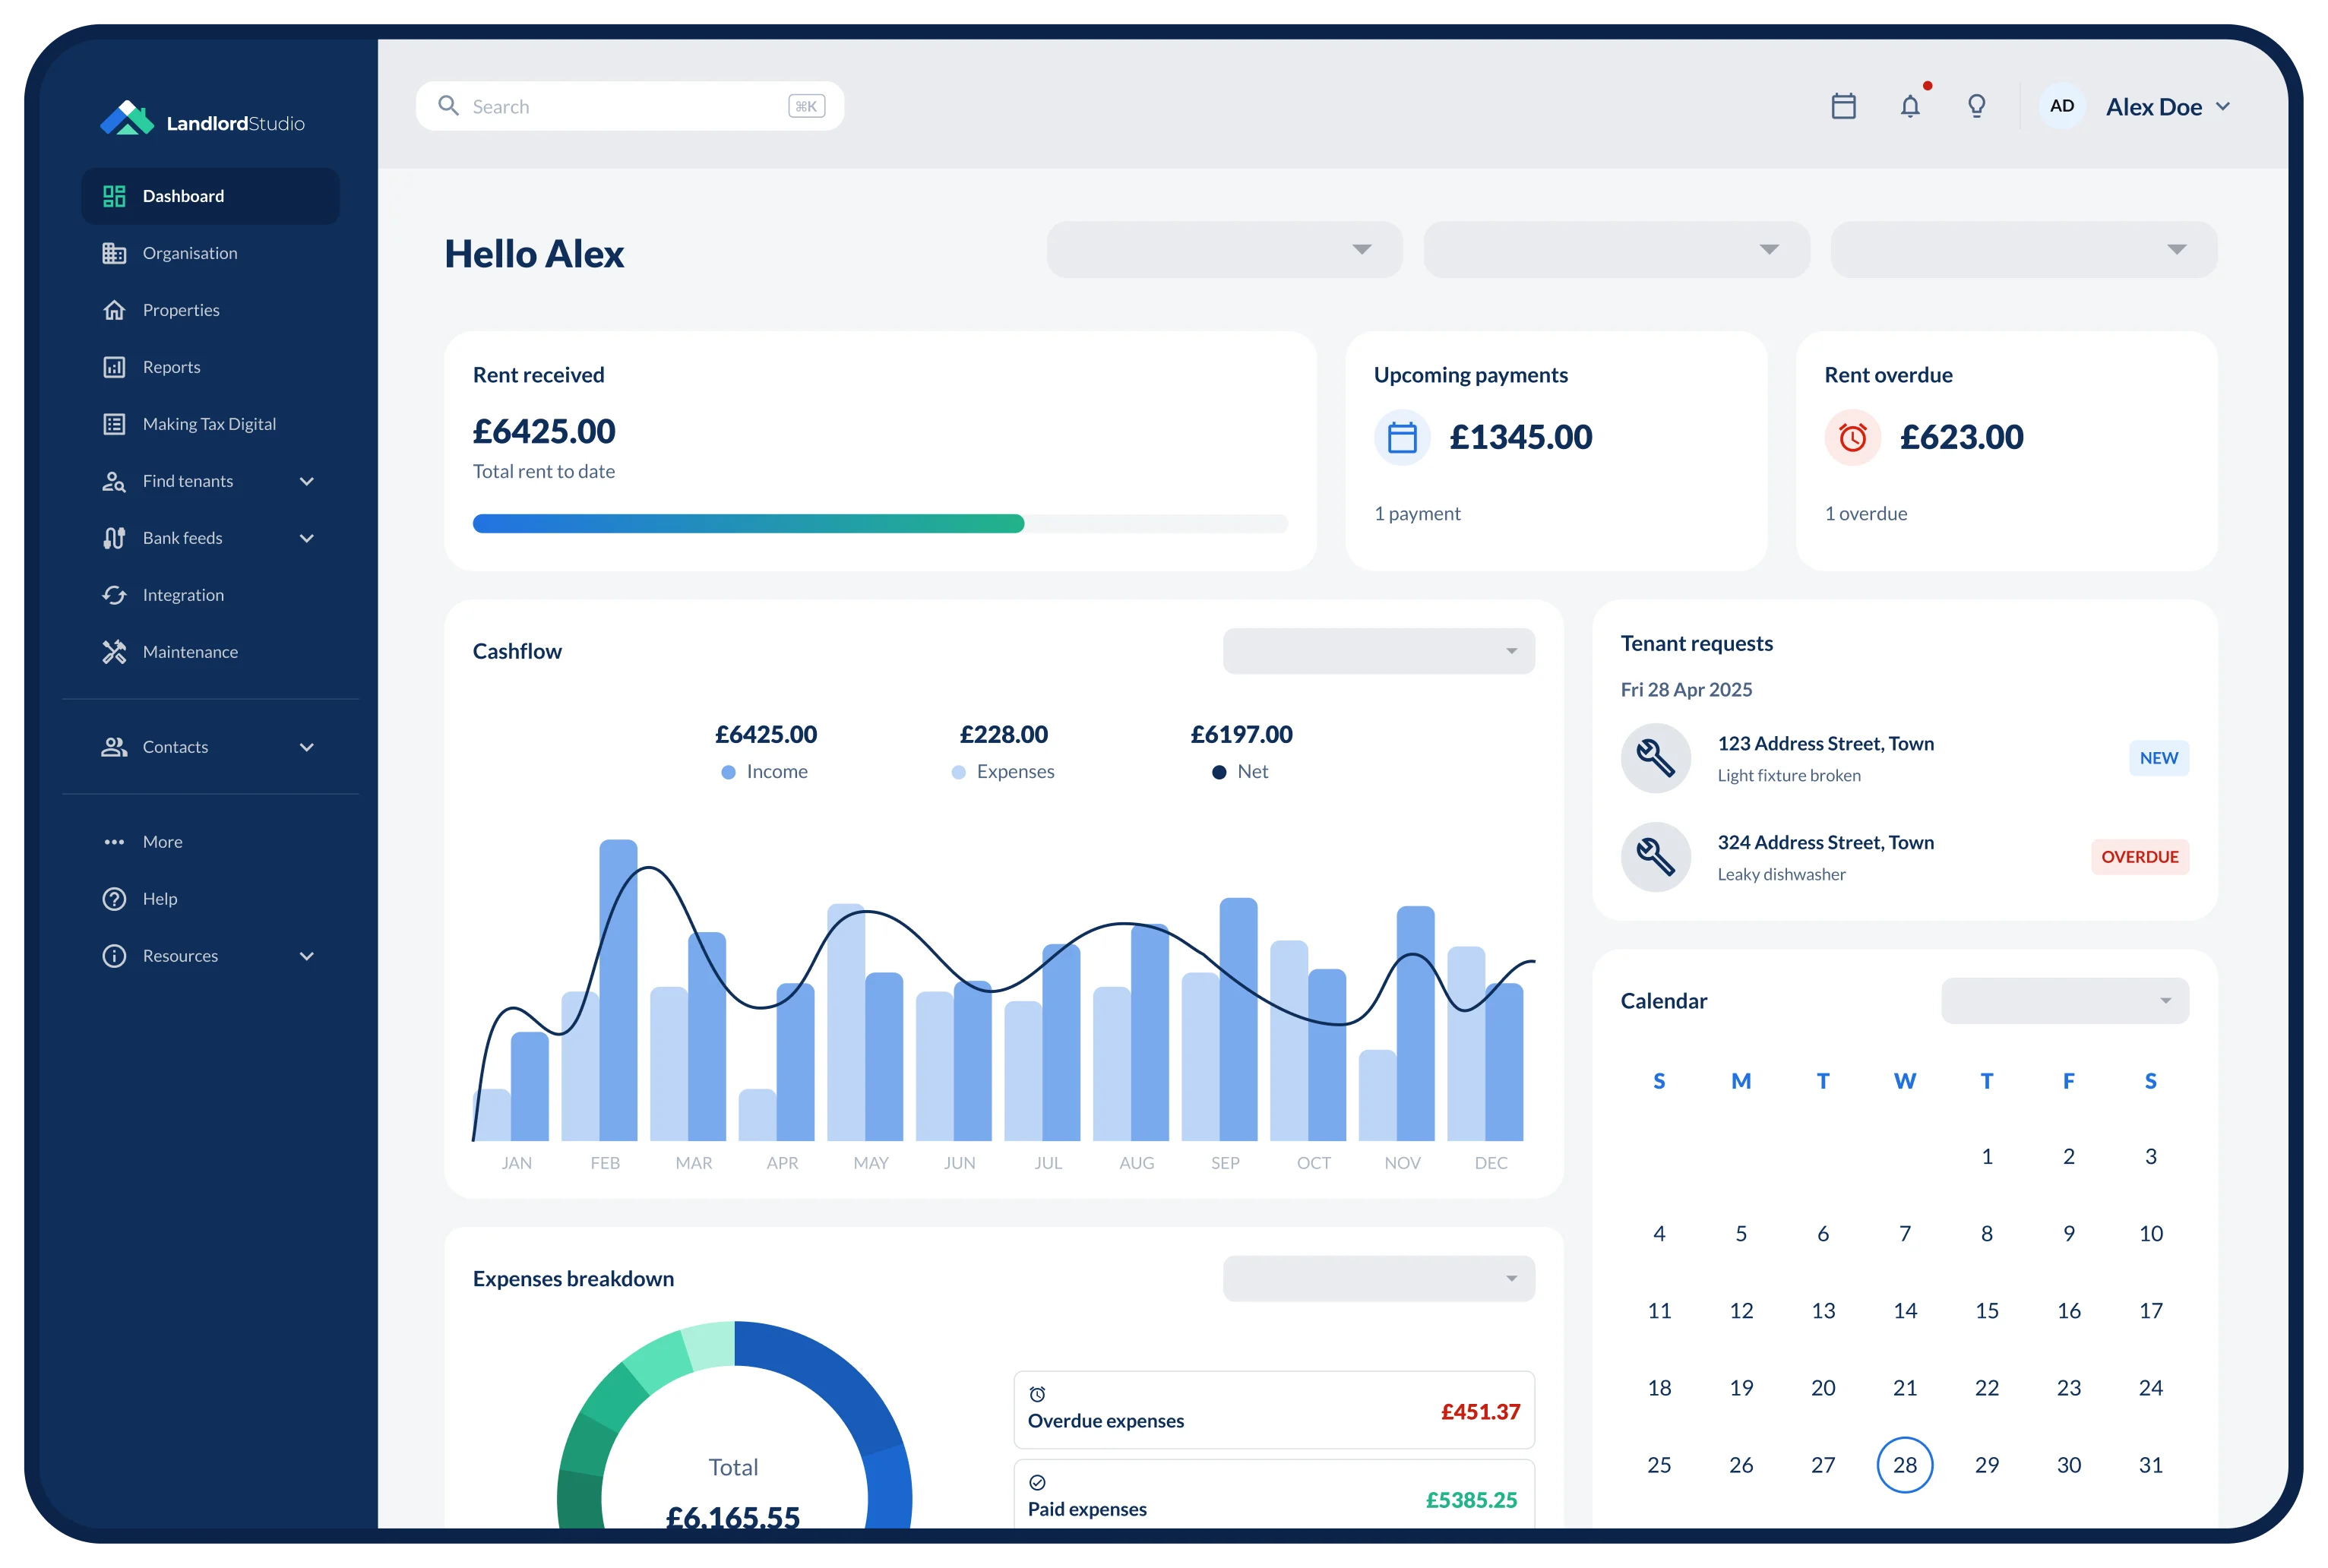
Landlord Studio is designed by landlords for landlords. Make your income and expense tracking easy with powerful automation tools and instantly generate any of over 15+ accountant approved reports, including an income and expense statement. This customizable statement allows you to get a full breakdown of your portfolio income and expenses on a month by month and property basis.
All of our reports are filterable by date range, income and expense categories, and property owner meaning you can easily generate monthly reports, a T12 statement, a year-to-date profit and loss statement, or an end-of-year income and expense statement.
With this data at hand, quickly identify potential problems and compare actual results to predictions and budgets.
Ditch the spreadsheets and create your FREE Landlord Studio account today
The income statement for a rental property is a comprehensive report delineating monthly income and expenses. It provides a year-to-date cumulative total and a year-end summary, serving as a profit and loss statement (P&L). This financial document effectively gauges whether the rental property is operating at a profit or incurring a loss.
What is the income statement of a property?
The real estate income statement, often referred to as a P&L, systematically outlines a property's income, expenses, and net operating income (NOI). The NOI, a pivotal metric highlighted in the income statement, plays a crucial role in various real estate financial calculations, including capitalization rate (cap rate) and debt service coverage ratio (DSCR).
Is rent income recorded in income statement?
Rental income is recorded as revenue and featured on the rental income statement. This line item signifies the amount earned through the leasing of assets such as buildings. The rental income is increased when revenue is generated from renting out the property.
How do you record rent income?
Once the rent is received the property owner should record the total rent amount collected against the total rent amount expected for that period. Doing both will allow landlords to forecast expected income for the year, maintain an up to date record not only of taxable income, and also keep a record of overdue rent amounts that need to be chased.
What is a landlord in accounting?
Landlord accounting refers to the specific accounting practices and financial management activities undertaken by individuals or entities that own and lease out real estate properties. Landlords, whether residential or commercial property owners, engage in accounting processes to effectively manage their rental properties, track income and expenses, and maintain accurate financial records.
About Landlord Studio
Landlord Studio is an easy to use property management and accounting software designed for landlords.
Find and screen tenants, collect rent online, track income and expenses, run reports, and more - all for free.
Get weekly tips, tax updates, and landlord strategies straight to your inbox.
Thanks for subscribing. Check your inbox, your first update is on the way.
Oops! Something went wrong while submitting the form.
Webinar: Inherited Tenants: Due Diligence for Buyers
A due diligence playbook for investors buying tenant-occupied rentals - uncover the hidden risks, plug the profit leaks, and build the systems that turn an inherited tenancy into a value increase.
Details:
Free
Hosted by:
Matt Hardy
Jennifer Ruelens
When:
August 26, 2026
10:00am PT / 1:00pm ET
Duration:
45 mins
Format:
Live Webinar
Guest:
Jennifer Ruelens, Property Manager, Investor & Founder with 20+ Years Experience in Real Estate
Co-host Matt Hardy, Head of Marketing at Landlord Studio


.jpg)


