11 Real Estate Investing Metrics that Investors Need to Know
Understanding real estate investing metrics will help you differentiate a bad deal from a great deal and give you the tools and data you need to achieve rental profitability.
Metrics matter. When it comes to real estate investing they are how you tell a bad deal from a great deal, they expose the strengths in your portfolio and highlight areas of operational inefficiencies. With the right data and the right metrics, real estate investors are fully equipped to scale their portfolios and achieve financial freedom.
In this article, we take a look at 11 key real estate metrics that landlords need to know about, from cap rate to occupancy rates, and we explore some of their strengths and weaknesses.
Understanding Real Estate KPIs
Monitoring real estate key performance indicators (KPIs) is crucial for both property managers and landlords. These KPIs offer a way to form a quick assessment of your real estate portfolio performance enabling easy identification of strengths and areas needing enhancement.
With this data at hand and an understanding of benchmark data and your long-term financial goals, you can leverage these KPIs to set realistic and ambitious goals and make better more informed data-based decisions to reach these goals.
Each real estate metric we outline in this article highlights a different financial facet of your real estate business, offering valuable insights into its competitive standing.
How To Track Real Estate KPIs
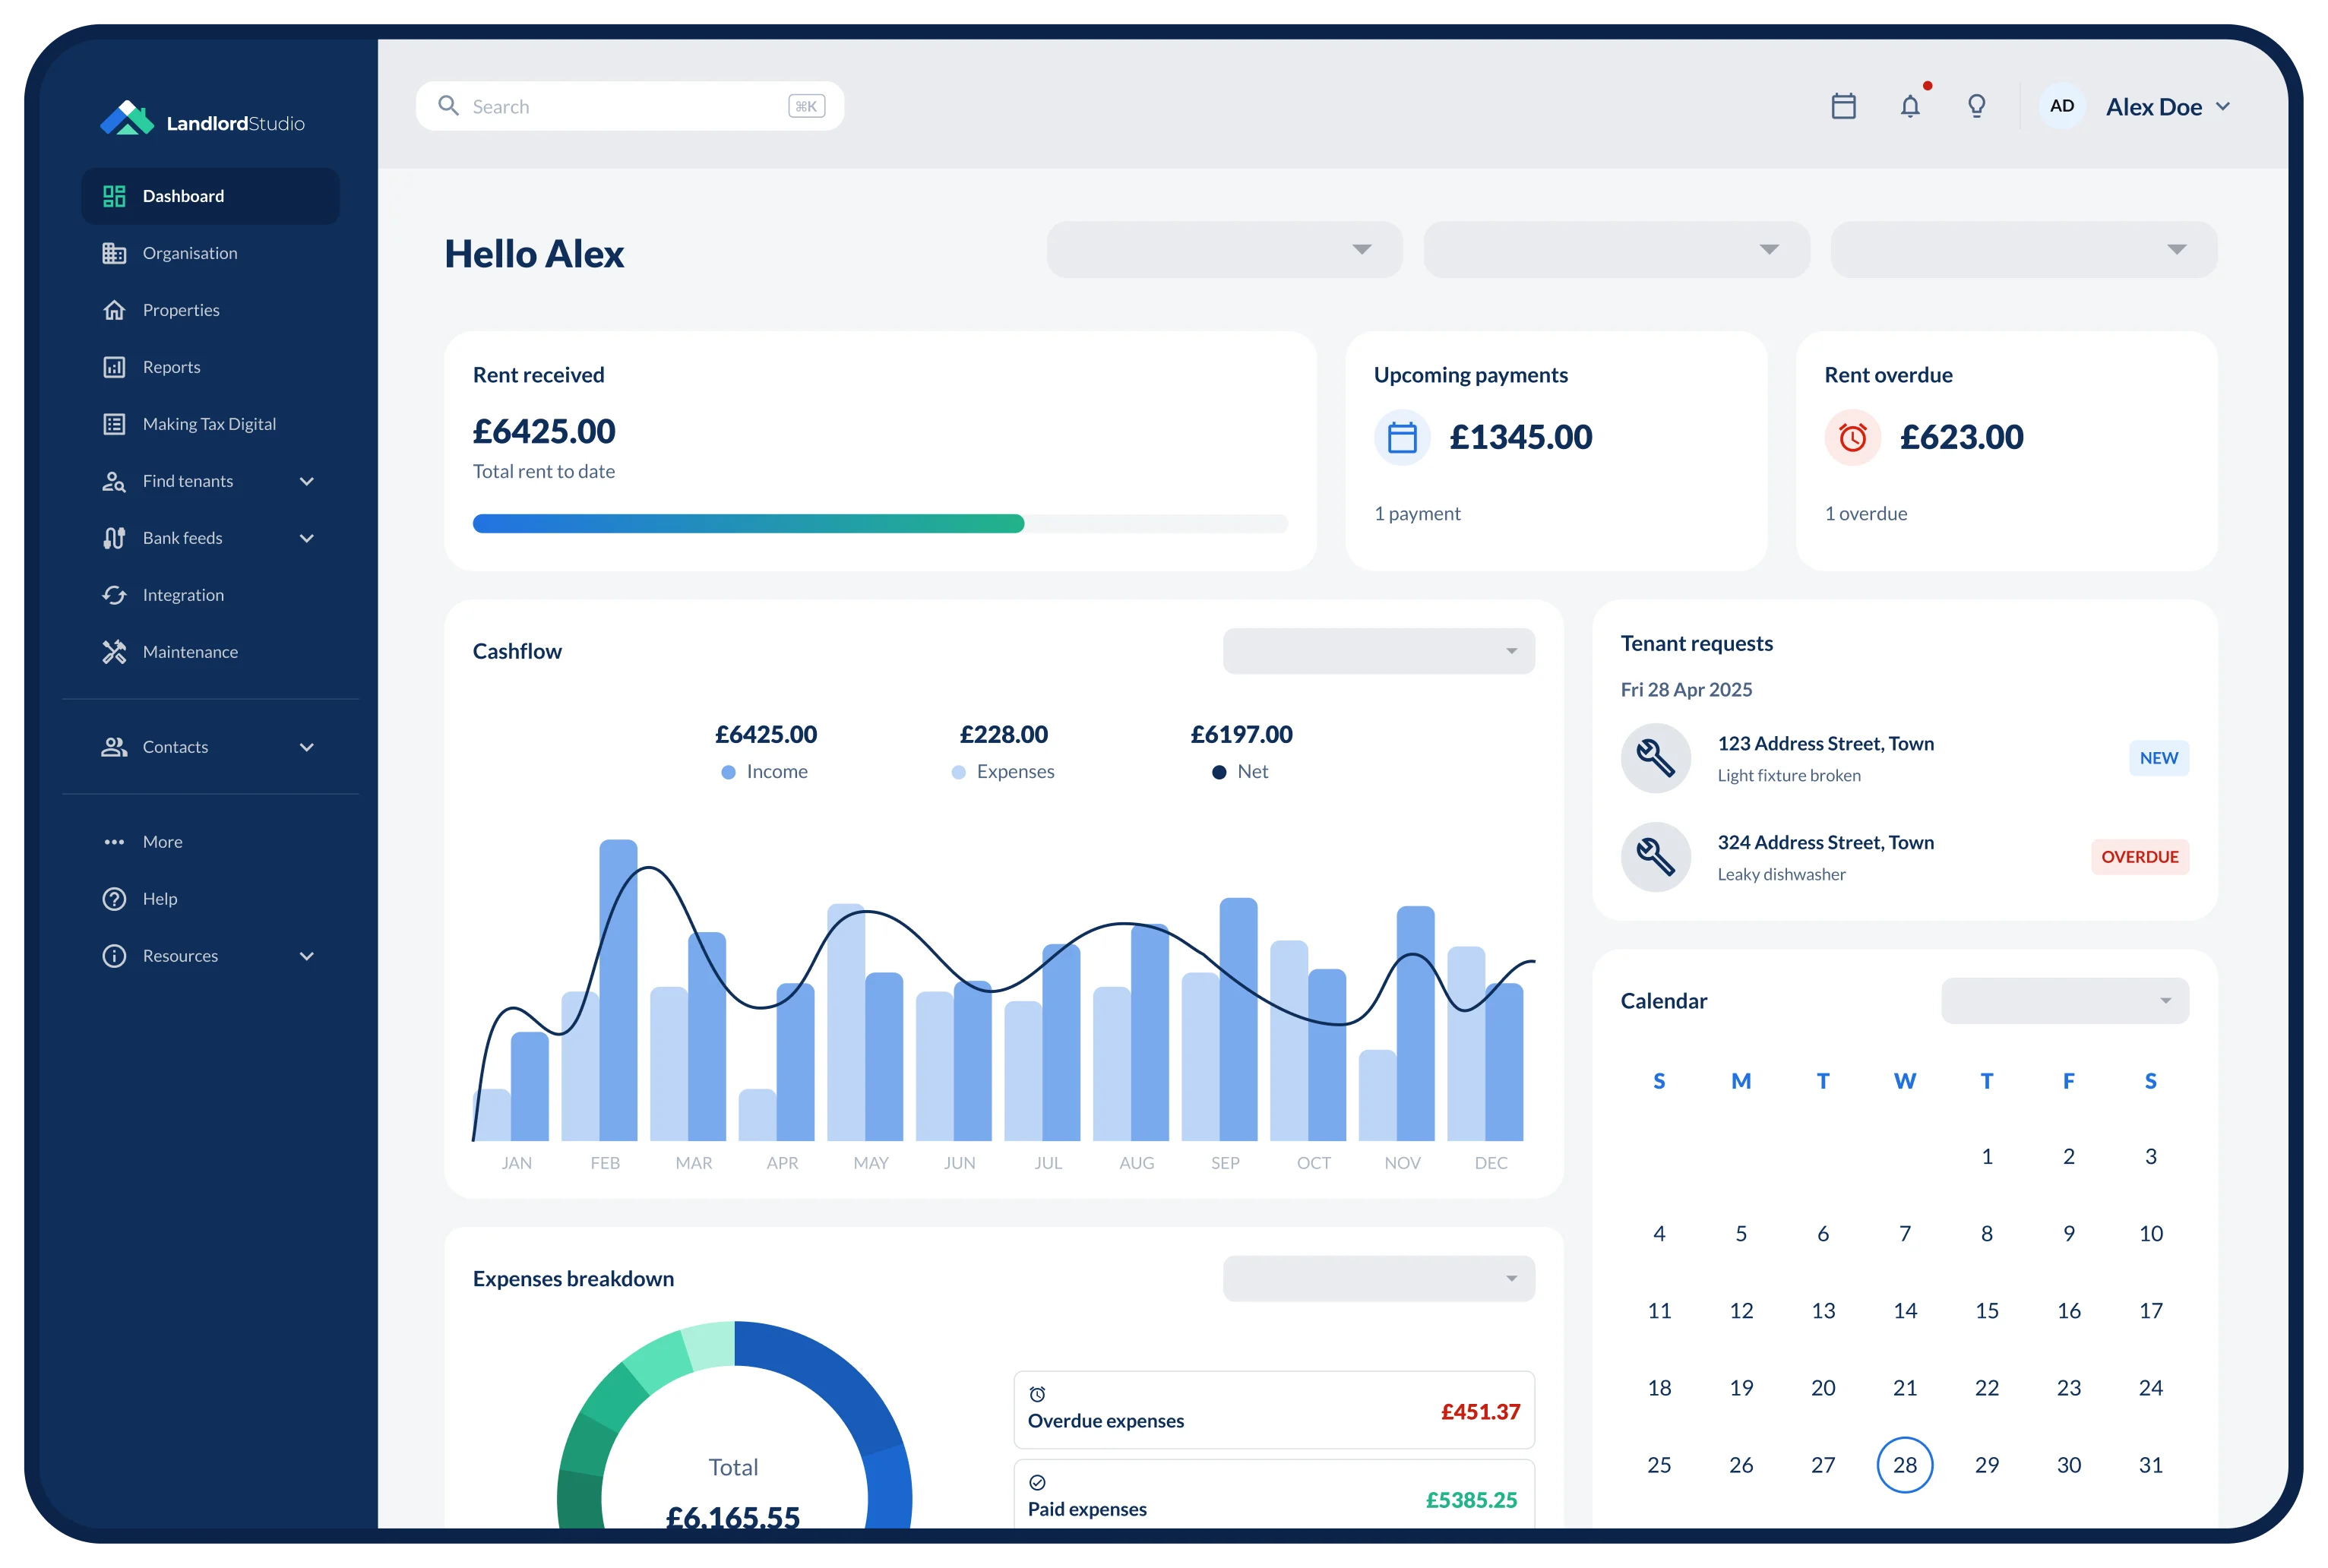
Tracking property management KPIs doesn't have to be daunting; numerous helpful tools are available for this purpose. Purpose-built software like Landlord Studio, for instance, can enable you to streamline data entry and generate insightful reports and graphs showcasing your portfolio’s financial performance and giving you fast access to accurate financial data.
Alternatively, manual tracking using spreadsheets to monitor various business metrics can be effective, allowing for performance comparison over time.
The Top 11 Real Estate Metrics Landlords Need To Know
1. Capitalization Rate
Capitalization rates, otherwise known as cap rates, are one of the important starting points for real estate investors. Essentially, the cap rate allows real estate investors to estimate the potential returns on a property. You can use the cap rate, for example, to compare similar properties in different markets to get a basic understanding of returns and risks.
To calculate the capitalization rate you divide annual net operating income by the cost or value of the asset.
Capitalization Rate = Net Operating Income / Current Market Value
Since cap rates are based on the projected estimates of the future income, they are subject to high variance. It then becomes important to understand what constitutes a good cap rate for an investment property.
The rate also indicates the duration of time it will take to recover the invested amount in a property. For instance, a property having a cap rate of 10% will take around 10 years to recover the investment.
Ideally, you want a reasonably high cap rate then. However, a major flaw with this particular metric is that it doesn’t account for the associated risks that come with running a rental property. For example, the age or location of the property, the property type, or the tenant’s reliability. As such, it can only give you an indication of the property's potential rather than an accurate picture or rate of return or risk.
In real estate, the gross operating income (GOI) metric assesses the potential income of a rental property after factoring in losses due to vacancies and credit issues.
GOI represents the total anticipated annual income from the property.
To calculate real estate GOI follow these steps:
Determine Potential Gross Income (PGI): PGI is the total income the property would generate if all units were rented out at market rates, with no payment collection issues.
Estimate Vacancy and Credit Losses: This involves predicting losses due to unoccupied units and tenants unable or unwilling to pay rent on time. Typically, vacancy and credit losses are expressed as a percentage of PGI, informed by historical data and market analysis.
Deduct Vacancy and Credit Losses from PGI: Subtract the estimated losses from PGI to obtain the GOI, reflecting the property's actual income potential after accounting for vacancies and credit issues.
3. Net Operating Income
The net operating income (NOI) takes the gross operating income (GOI) and then also accounts for the operating expenses. This number then gives you the basis for estimated profit.
NOI includes income from rent, parking, and other monthly fees. Real estate expenses include vacancy and credit losses, property taxes, insurance, management fees (if they apply), utilities, maintenance expenses, household debits, and management expenses (legal, accounting, etc.). NOI does not include costs that are unique to each investor, such as a mortgage.
Net Operating Income = Real Estate Revenue - Operating Expenses
When this metric is used in other industries, it is referred to as “EBIT”, which stands for “earnings before interest and taxes”.
4. Internal Rate of Return
The internal rate of return (IRR) serves as a tool for assessing the future value of an investment in present-day terms. It aids in evaluating investment risk by comparing the future value of an investment to its present value in today's market, relative to the initial investment amount.
While applicable to various investment types, the internal rate of return is particularly useful in assessing real estate investments due to their long-term nature and potential for significant returns.
In real estate, the internal rate of return represents the anticipated profit a property could generate over the ownership period. Expressed as a percentage, it indicates the return achievable for each dollar invested.
However, it’s important to understand the metrics’ weaknesses. The main ones being that it assumes a stable rent environment without unexpected repairs.
5. Cash Flow
Cash flow indicates how well your property or business is operating. It is the net cash left at the end of the month after all expenses have been paid. This doesn’t account for taxes.
For example, your rent is $1,500 per month and your monthly expenses are $700 your cashflow would be +$800.
Cash flow = Rental income – Expenses
Cash flow is a simple but important number indicating the success or lack thereof of your business. If you have a property that is regularly negative cashflow for example then you will need to consider taking action to either resolve the issues or selling.
For a great example of why cash flow is just so important listen to our podcast episode with Gabriel Hamel who built his multi-million dollar portfolio using cash flow as his primary metric.
6. Cash On Cash Return
Cash on cash return is another important figure for determining an investment’s performance. To calculate the cash on cash return, sometimes known as the cash yield, calculate the total annual cash flow before tax and divide it by the total amount of cash invested.
Cash on Cash Return = Expected Rental Income Before Tax / Total Cash Invested
For example, a property might cost $200,000 with an estimated cash flow of $30,000. This would equal an estimated cash on cash return of 15%. It’s important to once again understand the weaknesses of the metric. It doesn’t account for future economic changes or unexpected expenses, though you can work them into your calculations to a degree.
For example, you might know that a new school is being built or new transport infrastructure which you believe increase the desirability of the neighbourhood in a years time.
The gross rent multiplier (GRM) is a metric investors use to roughly determine the worth of a building. To calculate this you need to divide the property's purchase price by its gross rental income. To project your GRM you will want to ask the current property owner to see their rent roll report.
GRM = Market Value / Annual Gross Income
Again, this metric doesn’t take into account expenses or vacancies so you wouldn’t use this metric alone to determine if a property is a good investment. It can, however, be a useful number to calculate when comparing like properties.
8. Loan to Value (LTV) Ratio
The loan-to-value ratio is the ratio of the loan to the value of the asset you are purchasing. Financial institutes and lenders use LTV ratios to assess the risk of the loan.The higher the LTV the riskier you are seen to be by a lending or financial institute.
LTV is calculated by dividing the amount of the loan by the value of the property. For example, if the property is worth $250,000 and you have a deposit of $50,000, the LVR will be 80%.
Loan-to-Value = Loan Amount / Property Value
In general, the required LTV ratio can vary between lenders and by types of loans, generally speaking though, the accepted LTV ratio is between 65-80%.
To calculate your debt service coverage ratio you divide your net operating income by your debt payments on either a monthly, quarterly or annual basis.
OER = Operating Expenses / Potential Rental Income
You are looking for the lowest OER ratio which will indicate the most profitable property.
It’s worth noting that if your OER is rising over time, then you could have issues that need to be resolved. Perhaps by annual rent increases to match those annual expenses increases. Calculating OER using specific expenses can help you narrow down the reason for its rise and help you get it back under control.
11. Occupancy Rates
Unoccupied properties generate no income, yet most of the operating costs will remain the same, and there may even be additional operating costs associated with finding and screening new tenants. Investors tend to track historical occupancy rates and keep an eye on those units that lose income through higher vacancy rates.
For conservative, you should assume a vacancy rate of 5%-10% for all your expense calculations. This ensures that if the property does go unrented you will have the cash flow to cover your expenses during this period.
You can quickly run an occupancy report on Landlord Studio to determine each of your property’s historical occupancy rates and discover any potential discrepancies.
“Track income and expenses, screen tenants, set automatic reminders, and more with Landlord Studio.”
Additional Real Estate KPIs To Track
Maintenance cost per unit
Your maintenance costs are one of your major operational expenses. By tracking these you can develop ongoing forecasts as well as identify areas of potential overspend. For example, if you spent $1,000 repairing old appliances you might identify that to avoid future costs you could get warranty insurance, or that it might make more financial sense to proactively replace these appliances.
A high lease renewal rate signifies that tenants are happy with where they are, you’re doing something right. On the flip side, low renewal rates suggests there are potential issues that need to be fixed. Not dealing with these issues could lead to more vacancies and longer vacancy periods.
Landlord Studio Real Estate Calculators
For more real estate metric calculations you can use our range of free rental property calculators.
Free Rental Yield Calculator: Calculate your cashflow, and return on investment period by entering your property price, monthly rent, annual expenses, and vacancy rate below.
Free Mortgage Calculator: If you are looking to invest in real estate but not sure which property you can afford, our mortgage payment calculator is the best way to determine your threshold.
Free 70% Rule Calculator: The 70% Calculator is based on the “70% Rule of Thumb” which states that a rehabber should pay no more than 70% of the after repair value, less any repair costs or other profit needed.
Free Prorate Calculator: If your tenant doesn’t move in on the first day of the month, how do you work out how much rent is due for that first payment period? Use our Prorate Calculator to easily calculate the prorated rent.
Final Words: How To Track Your Real Estate Portfolio Performance
Having a clear overview and understanding of your portfolio will allow you to gain insights into which properties are and aren’t performing. However, it’s important to note while these metrics are great indicators, they never tell the whole story.
Even so, tracking the performance of your real estate portfolio is essential for making informed decisions and maximizing returns. One effective tool for this purpose is Landlord Studio, which streamlines your income and expense tracking and analysis. Easily monitor their revenue streams from each of your properties, collect rent online, digitize receipts, and reconcile bank transactions.
Landlord Studio offers intuitive features for organizing and viewing financial data. The comprehensive dashboard provides a clear overview of portfolio performance, including key metrics such as cash flow and occupancy rates.
Get weekly tips, tax updates, and landlord strategies straight to your inbox.
Thanks for subscribing. Check your inbox, your first update is on the way.
Oops! Something went wrong while submitting the form.
Webinar: Inherited Tenants: Due Diligence for Buyers
A due diligence playbook for investors buying tenant-occupied rentals - uncover the hidden risks, plug the profit leaks, and build the systems that turn an inherited tenancy into a value increase.
Details:
Free
Hosted by:
Matt Hardy
Jennifer Ruelens
When:
August 26, 2026
10:00am PT / 1:00pm ET
Duration:
45 mins
Format:
Live Webinar
Guest:
Jennifer Ruelens, Property Manager, Investor & Founder with 20+ Years Experience in Real Estate
Co-host Matt Hardy, Head of Marketing at Landlord Studio


.jpg)
%20(1).jpg)
.jpg)


