




.webp)
Read summarized version with:

ChatGPT

Gemini

Claude

Grok

Add as preferred on Google
A rental property can look promising on a listing page and still fail to produce enough cash flow once you account for vacancy, operating costs, repairs, reserves, and financing.
Our free rental property analysis spreadsheet brings those numbers together so you can evaluate an investment property before you make an offer. Enter your assumptions once and the template calculates monthly and annual cash flow, cap rate, cash-on-cash return, debt service coverage ratio (DSCR), gross rent multiplier (GRM), and a simple five-year projection.
Use it to answer one question: does this property meet your investment criteria at the price and financing terms you can actually get?
Download the free rental property analysis spreadsheet (works in Excel and Google Sheets):
Key takeaways
- Analyze the whole deal, not just the purchase price and headline rent.
- Use conservative assumptions for rent, vacancy, repairs, and ongoing expenses.
- Compare unlevered cash flow (before mortgage payments) with levered cash flow (after mortgage payments).
- Review several return and risk metrics together. No single ratio tells you whether a property is a good investment.
- Stress-test the deal before you make an offer. A 10% drop in rent turns the template's sample deal from a pass into a fail.
What the rental property analysis spreadsheet calculates
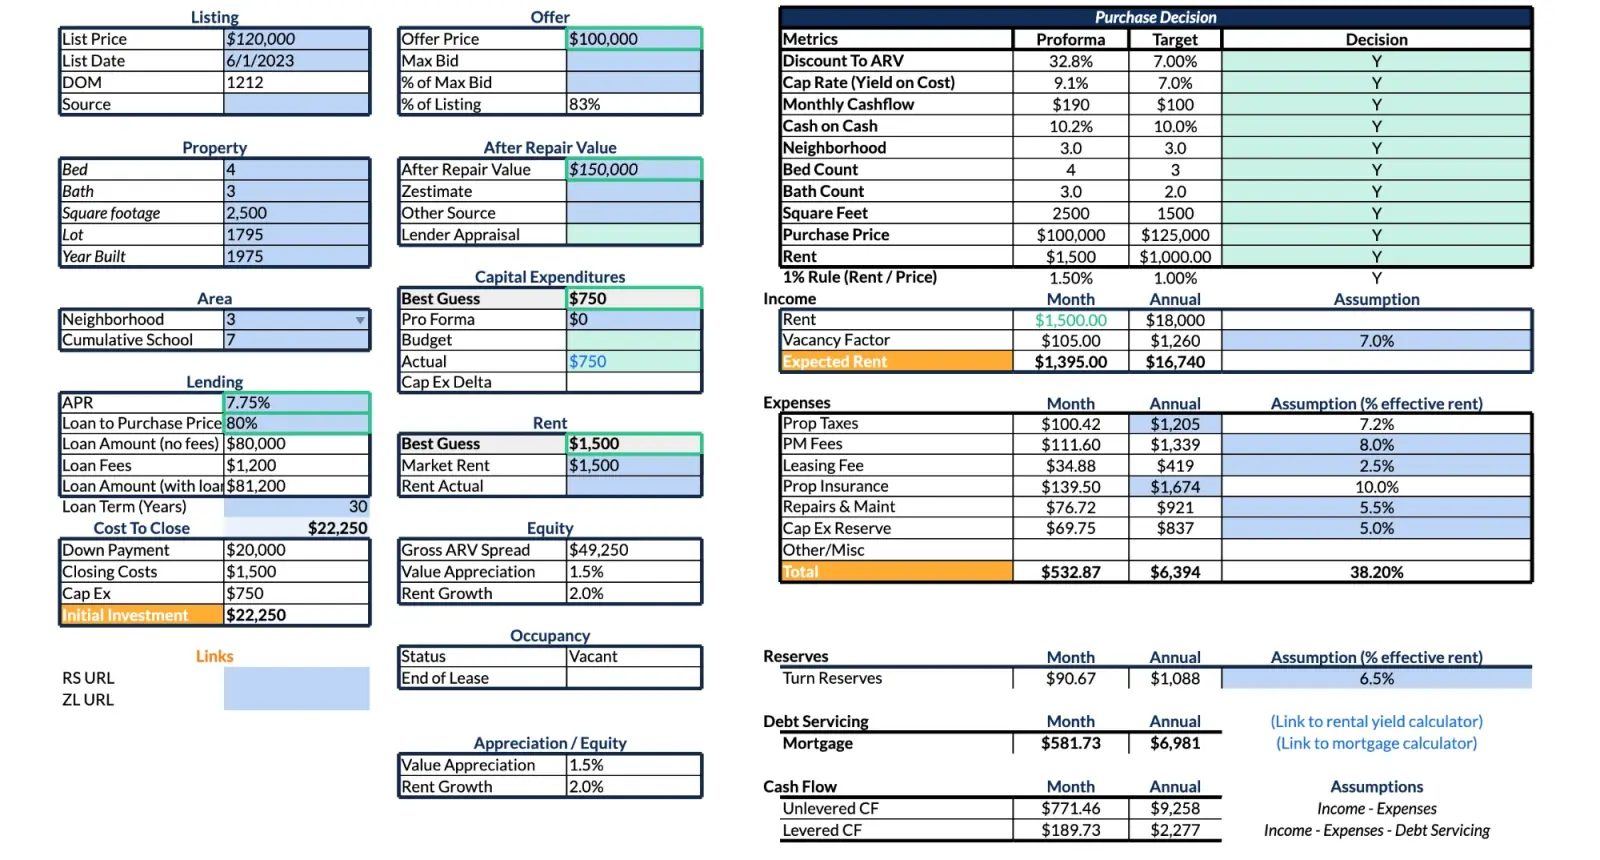
The template is built for buy-and-hold real estate investment analysis. It works like a rental property calculator in Excel: the acquisition, operating, and financing assumptions sit on one worksheet, and the outputs update as you change them.
It has a single rent line, so it suits single-family rentals and condos. For a small multifamily property, such as a duplex or fourplex, enter the combined rent for all units and the costs for the whole building.
Purchase decision scorecard
The scorecard compares the property's projected results with your buy box, the set of criteria a property must meet before you'll consider it. It checks:
- Discount to after-repair value (ARV)
- Cap rate based on your total acquisition cost
- Monthly cash flow
- Cash-on-cash return
- Neighborhood rating
- Bedroom and bathroom count
- Square footage
- Purchase price
- Monthly rent
- The 1% rule (monthly rent of at least 1% of the purchase price)
Each criterion returns a Y or N against a target value you can change.
Income and operating expenses
The spreadsheet starts with gross monthly rent, deducts a vacancy allowance, and calculates expected rent. It then deducts:
- Property taxes
- Property management fees
- Leasing fees
- Property insurance
- Repairs and maintenance
- Capital expenditure reserves
- Other or miscellaneous expenses
A separate turnover reserve covers the cost of changing tenants. The result is adjusted net operating income (NOI), which is your income after operating costs and reserves but before mortgage payments.
Financing and cash flow
Enter the offer price, loan-to-value ratio (LTV), interest rate, and loan term. The spreadsheet estimates:
- Down payment
- Loan amount, including loan fees
- Monthly and annual mortgage payments
- Initial cash investment
- Unlevered cash flow before debt service (your mortgage payments)
- Levered cash flow after debt service
Two costs are set by default rather than entered. Closing costs are 1.5% of the offer price (cell D36), and loan fees are 1.5% of the loan (cell D31). The loan fees are added to the loan balance, so the mortgage payment is calculated on the larger amount. If your lender quotes different figures, overwrite those cells.
This split between unlevered and levered cash flow matters. A property can perform well before financing and still produce weak cash flow because of its loan terms. Borrowing more can also raise your cash-on-cash return while adding repayment risk.
Investment metrics
The template also calculates:
- Cap rate, two ways
- Cash-on-cash return
- DSCR
- GRM
- Gross ARV spread
- Rent-to-price ratio for the 1% rule
It includes a five-year projection based on your expected annual appreciation and rent growth.
How to use the rental property analysis spreadsheet
Work through it in a consistent order. Start with facts you can verify, then add estimates.
1. Save a copy for the property
The template opens with a sample deal already filled in, so you can see how every section works before you replace it. Keep the original unchanged and save a new copy for each property, named with its address, so you can compare deals without overwriting earlier work.
If you upload the file to Google Sheets, check that the formulas carried over, especially the mortgage payment.
2. Add the listing and property details
Enter the address, list price, list date, source, bedrooms, bathrooms, square footage, lot size, year built, neighborhood rating, and school rating. Days on market calculates from the list date.
These fields let you apply the same buy box to every property. They also make it easier to revisit an analysis later and see why a deal passed or failed.
3. Enter your offer, ARV, and repair budget
Enter the price you expect to pay, not just the list price. If you've set a maximum bid, add it too; the sheet shows your offer as a percentage of both the list price and your max bid.
Next, estimate the after-repair value. The sheet has fields for a Zestimate, another source, and a lender appraisal so you can record each estimate, but only the After Repair Value field feeds the calculations. Support it with recent comparable sales (see our guide to comparative market analysis) and contractor quotes. Don't treat an automated valuation as proof of value.
For immediate repairs, the Capital Expenditures section has three fields: Pro Forma, Budget, and Actual. The sheet uses the most reliable one you've filled in. Actual overrides Budget, and Budget overrides Pro Forma. Cap Ex Delta shows how far actual costs ran over or under budget.
If the deal only works with an optimistic ARV or a small repair budget, the margin of safety is probably too thin. The spreadsheet uses these inputs to calculate your gross ARV spread and discount to ARV.
4. Estimate achievable rent and vacancy
Enter a market rent supported by comparable properties: similar homes nearby with comparable bedrooms, bathrooms, condition, amenities, and lease terms.
If the property already has a tenant, enter the current rent in Rent Actual. The sheet uses it in place of market rent, so your analysis reflects what the property earns today. Don't assume you can raise it right away. Lease terms, local notice requirements, rent-control rules, and the risk of losing the tenant all affect when and by how much rent can change.
Then add a vacancy assumption. Zero vacancy is rarely realistic over a long hold. Base yours on the local market, typical turnover, and the property's condition. Our guide to property vacancy rates explains how to estimate one.
The spreadsheet calculates:
Effective rent = Gross rent − Vacancy allowance
5. Add operating costs and reserves
Use actual bills where you can get them. For a property with an operating history, ask for recent income and expense statements, property-tax bills, insurance premiums, utility bills, maintenance records, and details of any HOA fees or special assessments.
Property taxes and insurance are entered as annual dollar amounts. Management, leasing, repairs, capital expenditure reserves, and turnover reserves are entered as a percentage of effective rent. The sample deal uses 8% for management, 2.5% for leasing, 5.5% for repairs, 5% for capital expenditure reserves, and 6.5% for turnover. Replace them with figures for your market. Use the Other/Misc row for anything else, such as HOA fees or utilities you pay.
Include management and maintenance costs even if you plan to do the work yourself. Your time has value, your plans may change, and it keeps different deals comparable.
The 50% rule, which assumes operating expenses take roughly half of gross rent before mortgage payments, is a useful sense check. It's no substitute for property-specific numbers.
6. Enter the financing assumptions
Add the interest rate, LTV, and loan term you can realistically get. A deal analyzed with an outdated rate or an undersized down payment can look much stronger than the one you'll actually close.
Check the default closing costs and loan fees against your lender's estimate. Cash-on-cash return depends on the total cash you invest, including closing costs and immediate repairs, not just the down payment.
7. Set your targets and review the results
The sample targets are placeholders, not recommendations:
- Discount to ARV: 7%
- Cap rate on cost: 7%
- Monthly cash flow: $100
- Cash-on-cash return: 10%
- DSCR: 1.25
- GRM: 10 or lower
Change them to match your strategy. A cash-flow investor will set different thresholds from someone buying in a high-appreciation market.
Don't just count the Y results. A failed DSCR or negative cash flow matters far more than missing a square-footage target. Ask:
- Is cash flow still positive after vacancy, reserves, and debt service?
- Does the return justify the cash you're putting in?
- Is there room for your estimates to be wrong?
- Which assumption moves the result most?
- Does the deal still work under a more conservative scenario?
How the key rental property metrics work

Monthly and annual cash flow
The template shows two versions of cash flow.
Unlevered cash flow is income after operating expenses and reserves, before mortgage payments:
Unlevered cash flow = Effective rent − Operating expenses − Reserves
Levered cash flow also deducts mortgage payments:
Levered cash flow = Unlevered cash flow − Debt service
In this template, unlevered cash flow and adjusted NOI are the same number. Levered cash flow is the closer estimate of what you keep each month. It doesn't include income taxes, depreciation, or one-off costs.
Cap rate
Cap rate compares annual NOI with the property's value or cost, before financing:
Cap rate = Annual NOI ÷ Property value or acquisition cost
The spreadsheet shows it two ways. The scorecard divides adjusted NOI by your offer price plus closing costs and immediate repairs. The Key Ratios section divides it by the purchase price alone. The gap between the two shows how much the extra cash to buy and prepare the property drags on your return.
For more, see our guide to the cap rate formula.
Cash-on-cash return
Cash-on-cash return measures annual cash flow after debt service against the cash you invested:
Cash-on-cash return = Annual levered cash flow ÷ Initial cash investment
It's the most useful metric for comparing financed deals because it focuses on your cash rather than the property's total value. It moves a lot with the down payment, interest rate, loan fees, closing costs, and repair budget. Our comparison of cash-on-cash return vs cap rate explains when to use each.
Debt service coverage ratio (DSCR)
DSCR compares annual adjusted NOI with annual mortgage payments:
DSCR = Annual adjusted NOI ÷ Annual debt service
A DSCR above 1.0 means projected operating income covers the loan payments. Below 1.0, the property doesn't earn enough to cover its mortgage. Minimum requirements vary by lender and loan product, so ask yours what it uses and enter that as the template's DSCR target.
Gross rent multiplier (GRM)
GRM compares the purchase price with gross annual rent:
GRM = Purchase price ÷ Gross annual rent
GRM ignores vacancy, expenses, reserves, and financing, so use it to compare properties quickly, not to judge profit.
The 1% rule
The 1% rule compares monthly rent with the purchase price:
Rent-to-price ratio = Monthly gross rent ÷ Purchase price
A result of 1% or more passes. But taxes, insurance, condition, financing, and local rents vary widely. A property can pass the 1% rule and still cash flow poorly, while another can miss it and still meet your targets. Use it to decide which listings deserve a full analysis.
Example: analyzing the sample deal
The template opens with an illustrative deal. The figures are for demonstration, and prices this low are rare in most US markets in 2026, but they show how every number connects.
The inputs
- Offer price: $100,000 (list price $120,000)
- After-repair value: $150,000, with $750 of immediate repairs
- Market rent: $1,500 a month, with 7% vacancy
- Property taxes: $1,205 a year. Insurance: $1,674 a year
- Loan: 80% LTV at 7.75% over 30 years
What the spreadsheet calculates
- Effective rent: $1,395 a month
- Operating expenses: $533 a month. Turnover reserve: $91 a month
- Adjusted NOI (and unlevered cash flow): $771 a month, or $9,258 a year
- Loan: $81,200 including fees, for a mortgage payment of $582 a month
- Levered cash flow: $190 a month, or $2,277 a year
- Initial cash investment: $22,250 ($20,000 down, $1,500 closing costs, $750 repairs)
- Cash-on-cash return: 10.2%
- Cap rate: 9.1% on total cost, 9.3% on purchase price
- DSCR: 1.33
- GRM: 5.6
- 1% rule: 1.5%
On these numbers the deal passes every criterion on the scorecard. The next section shows why that isn't the end of the analysis.
How to stress-test a rental property deal
Your projections are only as reliable as your assumptions. Before you make an offer, save three versions of the analysis: expected, conservative, and downside.
Here's what happens to the sample deal when the assumptions get worse:
- Rent 10% lower ($1,350): cash flow drops to $89 a month, cash-on-cash return to 4.8%, and DSCR to 1.15. It now fails the cash flow, cash-on-cash, and DSCR targets.
- Vacancy at 10% instead of 7%: cash flow drops to $157 a month and DSCR to 1.27.
- Interest rate at 8.75% instead of 7.75%: cash flow drops to $133 a month and DSCR to 1.21.
- All three at once: cash flow falls to $2 a month and DSCR to 1.00. The property barely covers its own mortgage.
A deal that passed every check falls apart after three modest changes. In your conservative and downside cases, also test:
- Higher management and leasing costs
- A larger repair and maintenance allowance
- A major capital expense in the first few years
- A lower LTV
- Repairs that run over the first contractor estimate
- No appreciation over the five years
If a small change turns a positive deal negative, you may need a lower offer or a bigger cash reserve.
How to read the five-year projection
The spreadsheet projects property value from your ARV and annual appreciation rate, and gross annual rent from your starting rent and annual rent growth. The sample deal assumes 1.5% appreciation and 2% rent growth, which takes the $150,000 ARV to about $161,600 and gross rent from $18,000 to about $19,900 by year five.
It's a directional view. It doesn't forecast future expenses, loan balance, selling costs, taxes, or capital projects, so use it to compare assumptions rather than to predict a sale price.
Common rental property analysis mistakes
1) Using the best-case rent
Base rent on comparable signed or advertised leases, then use a conservative figure. A deal that only works at the top of the market has no room for error.
2) Treating vacancy as optional
Even strong rental markets lose income between tenants and during nonpayment. Include a vacancy allowance that fits the property and market.
3) Forgetting reserves
Routine maintenance isn't the same as replacing a roof, HVAC system, water heater, or major appliance. Budget for both ongoing repairs and capital expenditure reserves.
4) Mixing NOI and levered cash flow
NOI is measured before mortgage payments. Levered cash flow is after them. Keeping them separate makes cap rate, DSCR, and cash-on-cash return easier to read.
5) Focusing on one metric
Cap rate, cash-on-cash return, DSCR, GRM, and the 1% rule answer different questions. Review them together with the property's condition, location, tenant demand, and your available cash.
6) Assuming appreciation will rescue a weak deal
Appreciation can add to long-term returns, but it's uncertain and it doesn't pay this month's bills. A buy-and-hold property should work without relying on a future sale price.
From projected performance to actual performance
The spreadsheet helps you decide whether to buy. Once you own the property, the job changes: you need to know whether it's performing the way your analysis said it would.
Landlord Studio tracks rent and expenses for each property, connects to your bank accounts, and digitizes receipts, so your actual numbers build up without extra data entry. Compare them with your original assumptions to catch rising costs, rent that's fallen below market, recurring maintenance problems, or cash flow that's slipping behind plan.
For more on ongoing reporting, see our guides to the rental property income statement and the profit and loss report. If you want simpler spreadsheets for tracking income and expenses, try our free rental property worksheets.
Frequently asked questions
What is a rental property analysis spreadsheet?
A rental property analysis spreadsheet estimates the income, expenses, financing costs, cash flow, and potential return of an investment property. It helps you compare a deal with your investment criteria before you buy.
What should a rental property analysis include?
At minimum: purchase price, repair budget, market rent, vacancy, operating expenses, reserves, financing terms, initial cash investment, monthly cash flow, cap rate, and cash-on-cash return. DSCR and GRM add useful context.
How do you calculate rental property cash flow?
Start with rental income, subtract vacancy and operating expenses, then subtract reserves and mortgage payments. The result is projected cash flow before income tax and depreciation.
What is a good cash-on-cash return for a rental property?
There's no universal target. It depends on the market, property risk, financing, workload, and your other investment options. Set a minimum that fits your strategy, then check the deal still meets it under conservative assumptions.
Can I use this spreadsheet for a multifamily property?
Yes, for small multifamily properties. Enter the combined rent for all units and the costs for the whole building. For larger apartment buildings with different unit types, you'll want a model that analyzes each unit separately.
Can I use the template in Google Sheets?
Yes. Upload the Excel file to Google Drive and open it in Google Sheets, then check the formulas carried over.
Does the spreadsheet replace professional advice?
No. It's an estimation tool. Verify taxes, insurance, rent, repair costs, financing terms, zoning, building condition, and legal requirements with local professionals before you buy.
Analyze your next rental property
A good analysis won't remove uncertainty, but it shows you where the risk sits and how much room the deal has for error.
Download the free template, replace the sample deal with your own numbers, and run more than one scenario before you make an offer. If the numbers still work with lower rent, higher costs, and a higher rate, you can make that offer with confidence.