




Read summarised version with:

ChatGPT

Gemini

Claude

Grok

Add as preferred on Google
The North East has the best rental yield in the UK, even after maintenance and void periods.
After analysing five years of real expense records from self-managing landlords, Landlord Studio found that maintenance takes 19.8% of rent in the North East, against 6.0% in London.
Once maintenance and voids come out, the gap between the highest and lowest yielding regions narrows from 2.8 percentage points to about 1.4.
Key findings
- In Landlord Studio's data, the average single-unit rental costs about £1,330 a year in maintenance and repairs, 9.0% of the rent it earns. The median year costs about £420.
- Maintenance takes about a fifth of rent in the North East (19.8%) and Scotland (19.5%).
- It takes the smallest share in London (6.0%) and the West Midlands (6.8%).
- After maintenance and voids, the North East still leads, at about 6.1%. The North West and Scotland follow, both at about 6.0%.
- The North West draws level with Scotland, despite a gross yield 0.8 points lower. The West Midlands draws level with Yorkshire and the Humber, at 5.7%.
- London stays last, at 4.7% after maintenance and voids, but loses the fewest percentage points to them.
Where are the best rental yields in the UK after maintenance and voids?
These are indicative estimates combining Zoopla’s regional gross yields with Landlord Studio’s recorded maintenance and void costs, before other expenses.
- Top three after costs: the North East (6.11%), the North West (5.96%) and Scotland (5.95%).
- Lowest: London, at 4.72% after maintenance and voids.
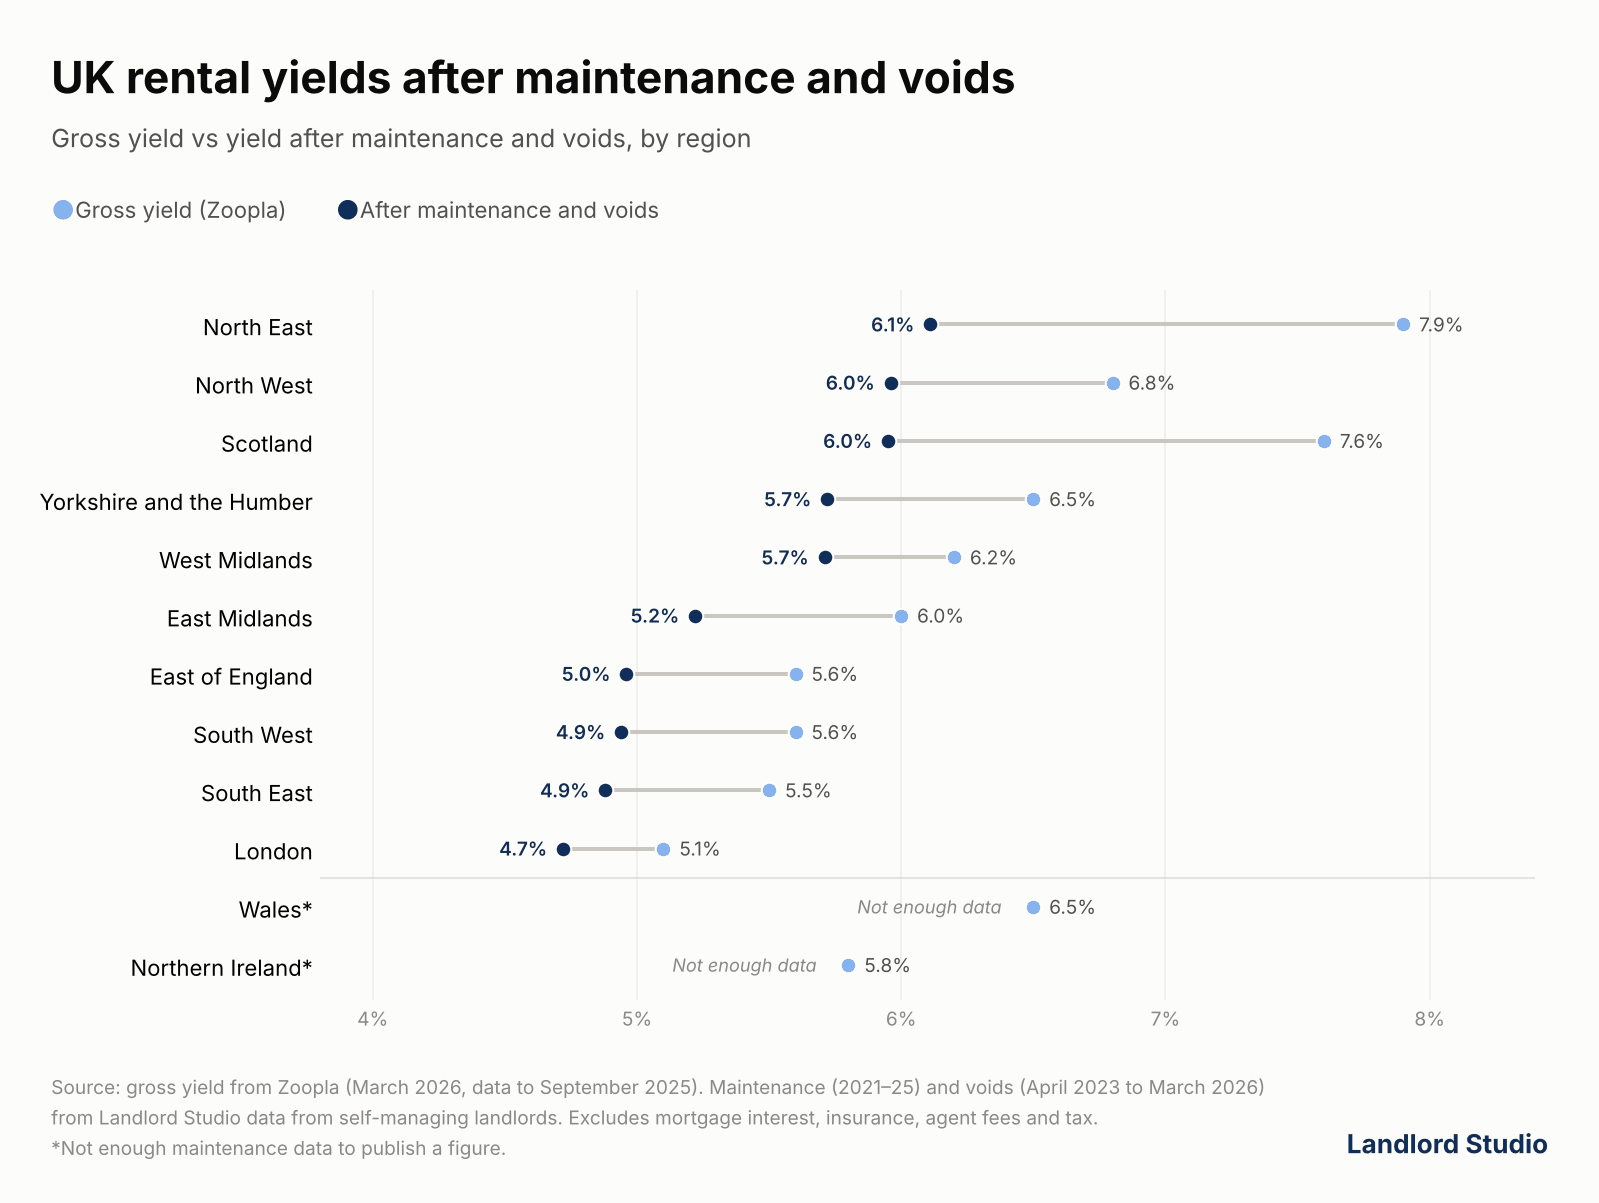
Note: regions are listed from highest to lowest yield after maintenance and voids. Wales and Northern Ireland, marked with an asterisk, don't have enough maintenance records in our data to publish a reliable figure, so they are listed at the bottom. The final column is shown to two decimal places to separate close regions, but differences under 0.1 points are too small to call. Gross yield: Zoopla's regional average gross yield, published March 2026.
Maintenance has taken a shrinking share of rent as rents have risen, from 10.5% in 2021 to 8.2% in 2025.
This is not a full net yield. It does not include mortgage interest, insurance, letting agent fees, service charges or tax, which vary too much between landlords to model by region. Use the rental yield calculator to work out the full figure for a specific property.
Where does maintenance take the most rent?
Maintenance takes about a fifth of rent in the North East (19.8%) and Scotland (19.5%), and the smallest share in London (6.0%).
- North East: landlords spend an average £1,526 a year on maintenance, about £200 more than the UK average of £1,329, on an average rent of £7,720. Maintenance takes 19.8% of rent, more than three times the share in London.
- Scotland: landlords spend £1,697 a year, the most of any region, on an average rent of £8,717. Maintenance takes 19.5% of rent.

For landlords comparing areas, the point is that repair bills do not fall in line with rents. A cheaper property in a high-yield area can need the same new boiler as one in the South East.
Wales and Northern Ireland are not shown because there is not enough data. The UK row includes them.
Which regions lose the most yield to running costs?
The North East loses the most, about 1.8 percentage points of gross yield, to maintenance and voids.
London loses the fewest, about 0.4. That narrows the gap between the top and bottom regions from 2.8 points on gross yield to about 1.4.
Scotland loses almost as much as the North East, about 1.6 points. That lets the North West, whose gross yield is 0.8 points lower, draw level with it.
The West Midlands draws level with Yorkshire and the Humber at 5.7%, despite starting 0.3 points lower. It has the second-lowest maintenance share and the lowest void share of the regions we can rank.
Do bigger rentals cost more to maintain?
Yes. Maintenance rises from about £940 a year for a one-bedroom home to about £2,330 for four bedrooms or more. As a share of rent it stays between 8% and 11% at every size, and two- and three-bedroom homes take the biggest share.
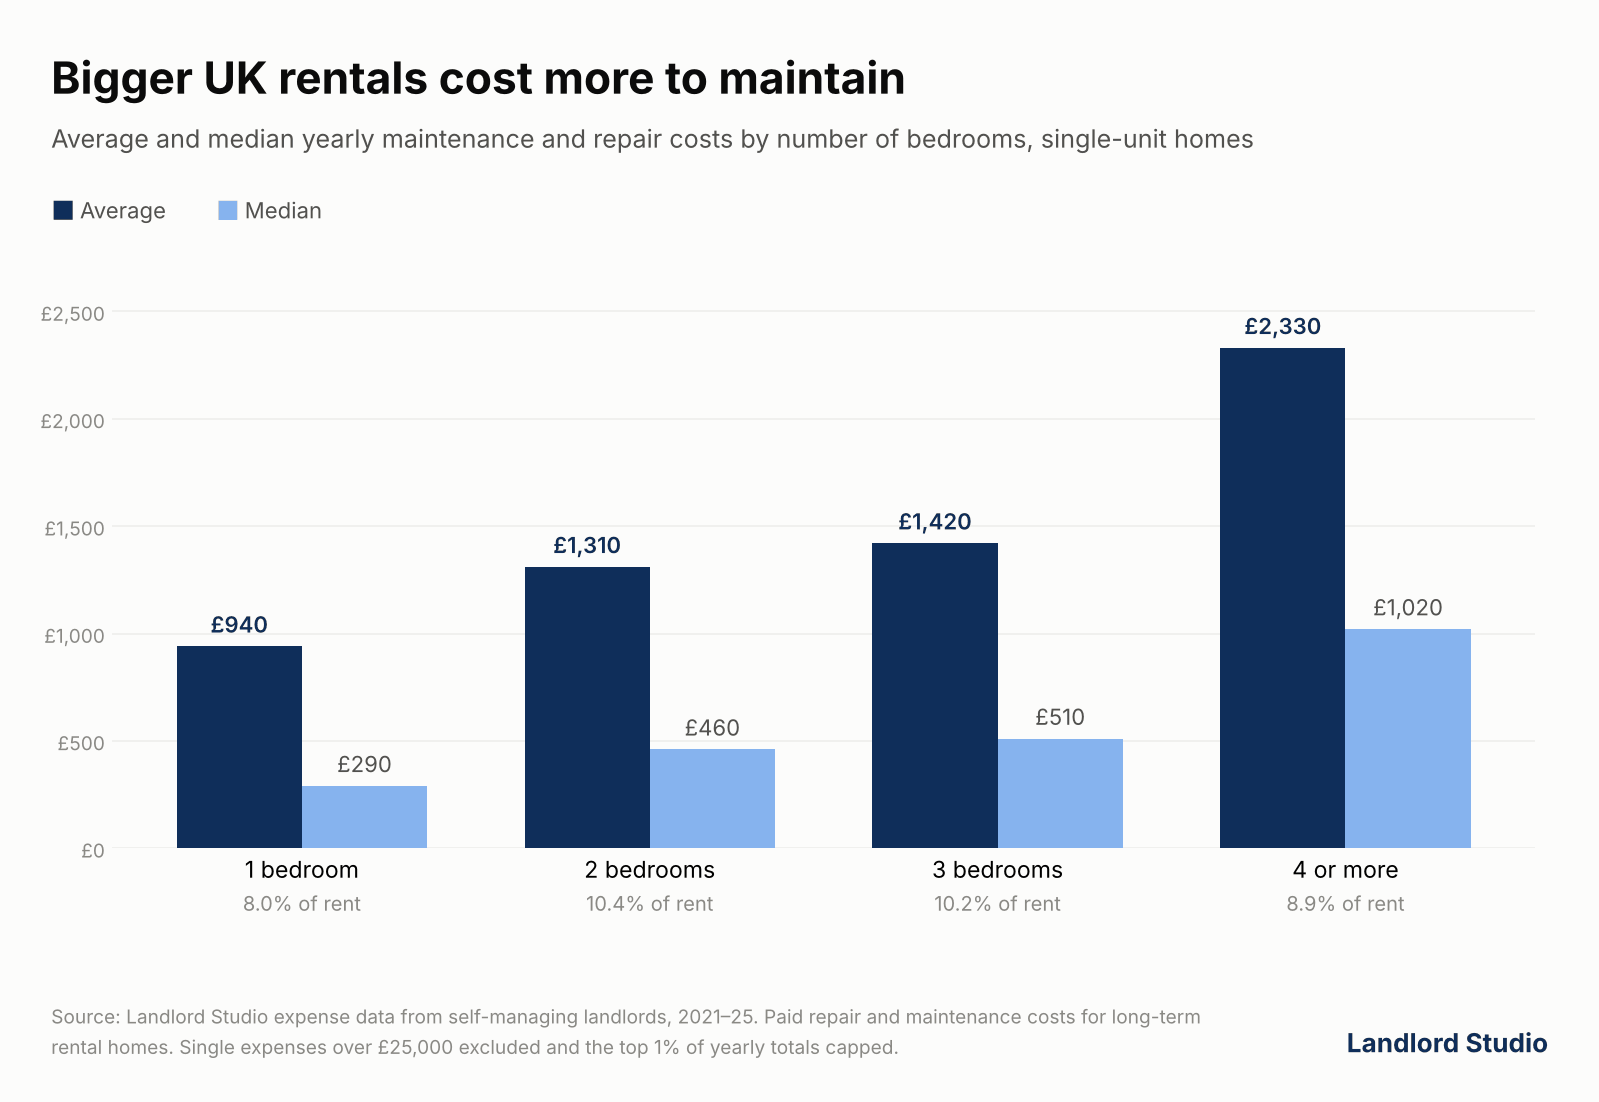
The median year is far cheaper than the average at every size. This pattern suggests that most years bring small repairs, and a few years with a large job drive the average.
What is the rental yield in London after costs?
London has the lowest gross yield in the UK, at 5.1%, and about 4.7% after maintenance and voids. It loses the fewest percentage points to those costs of any region.
Inner and Outer London lose the same share of rent to maintenance, 6.0%. Inner London landlords spend more, an average £1,680 a year against £1,270, but on higher rents of about £28,180 against £21,250.
Voids differ more. Inner London loses 1.2% of rentable days to voids and Outer London 1.7%, with median voids of 13 and 22 days.
Is buy to let worth it in 2026?
It depends on the property, the finance and your plans, and yield is only part of the picture. This ranking ignores capital growth, tenant demand and finance costs, and it is not financial advice. What the data does show is that running costs vary a lot by region: a 7.9% gross yield in the North East is closer to 6.1% after maintenance and voids, before any mortgage, tax or other costs.
Our guide to allowable expenses for landlords explains which of those running costs you can claim against tax.
What is the average rental yield in the UK?
Zoopla puts the average UK gross rental yield at 5.8%. In Landlord Studio's data, maintenance takes an average 9.0% of rent and voids about 1.5%. That makes a 5.8% gross yield about 5.2% after those costs.
What is a good rental yield in the UK?
There is no single figure. Zoopla's regional averages run from 5.1% in London to 7.9% in the North East, so compare a property against its own region. In Landlord Studio's data, maintenance and voids take 7% to 23% of the gross yield (0.4 to 1.8 percentage points), depending on the region.
Know your real yield, not just your gross yield
Maintenance takes anywhere from 6% to 20% of rent depending on the region, so your true yield depends on what each property costs to run. With Landlord Studio's rental accounting software, you can log every repair against the property it belongs to. Landlord Studio is also recognised by HMRC as Making Tax Digital software.
Methodology
Gross rental yield is the number most landlords compare: annual rent divided by the property price. It ignores the money that comes straight back out of the rent. Repairs and empty weeks between tenancies cost some regions far more than others. We used real expense and tenancy records from self-managing landlords in Landlord Studio. For each region, we measured how much of the rent goes on maintenance and voids, then applied those costs to Zoopla's latest regional gross yields.
Other details
This analysis combines anonymised landlord data from Landlord Studio with published gross yields. The three sources cover slightly different periods, listed below.
- Maintenance: paid repair and maintenance expenses for long-term rental homes, January 2021 to December 2025. We count only expenses a landlord entered, edited or reconciled themselves. Automatically repeated entries are left out unless the landlord confirmed them. Capital improvements and costs paid by tenants are excluded.
- Which years count: a home's year counts only if the home was let on a long-term tenancy that year and the landlord recorded expenses in at least three quarters of it, both for the account and for that home.
- Maintenance as % of rent: average annual maintenance divided by average annual rent from the home's tenancy that year, for single-unit homes. All £ figures are for single-unit homes. Single expenses over £25,000 are excluded, and the top 1% of yearly totals are capped.
- Rent lost to voids: days homes sat empty between tenancies as a share of days they were being let, April 2023 to March 2026. Gaps of up to 90 days count as void. Longer gaps count as void only where there is evidence; otherwise the days after the first 90 are left out. Gaps over a year are excluded. Counting those uncertain days as void would raise the UK figure from 1.5% to 1.6%.
- Median void: the median number of days between one tenancy ending and the next starting, for completed voids.
- Minimum sample: we publish a regional figure only where it rests on enough homes and enough landlords. Wales and Northern Ireland fall short for maintenance, so their yield after costs is not shown.
- Gross yield: Zoopla's average gross rental yield by region, published March 2026, using data to September 2025.
- Yield after maintenance and voids: Zoopla gross yield multiplied by one minus our maintenance share and void share for the region. This combines two different data sources, so treat it as an estimate. Void figures exclude empty days after a home's last tenancy and gaps over a year, so they are a minimum, and this column is a best case.
- Regions: based on the property's postcode sector, matched to its local authority and region using the ONS postcode lookup.